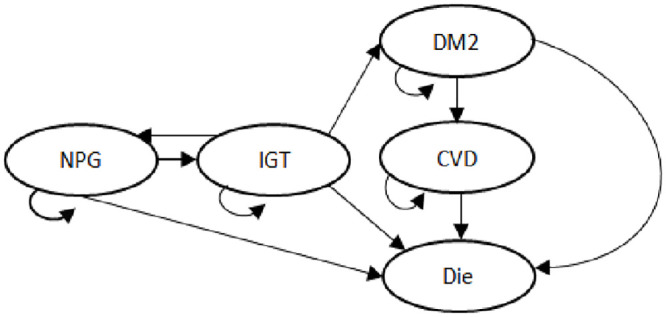
Fig 1. Structure of the diabetes state-transition model.

Simulated patients transit in the model following the arrow direction. Simulation is concluded when all simulated patients transit to the ‘death’ state.

Simulated patients transit in the model following the arrow direction. Simulation is concluded when all simulated patients transit to the ‘death’ state.