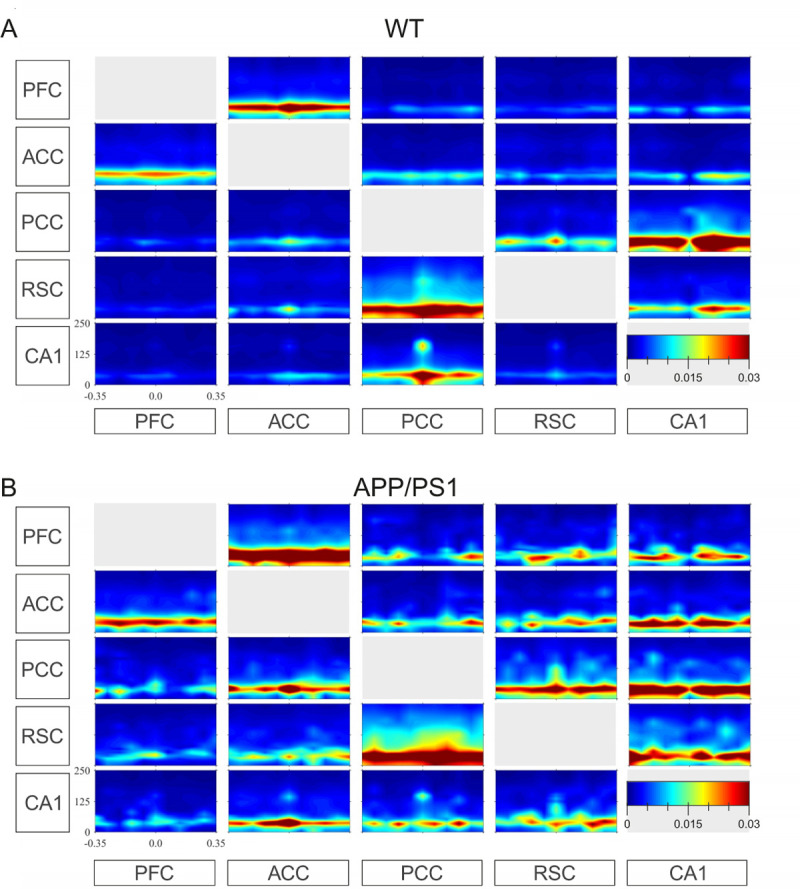
Fig 2. Time-frequency map of the effective coupling between CA1 and multiple cortical sites.

dDTF plotted as function of time and frequency are averaged over WT (A) and APP/PS1 (B) groups. Every box shows effective coupling from the channel indicated below a given column to the channel indicated next to a given row. Time 0 indicates SWRs peak power. The color code indicates the value of the . Note strong coupling in the SWRs (130–180 Hz) and slow gamma (20–60 Hz) bands. Units: seconds (x-axis) and Hz (y-axis).
