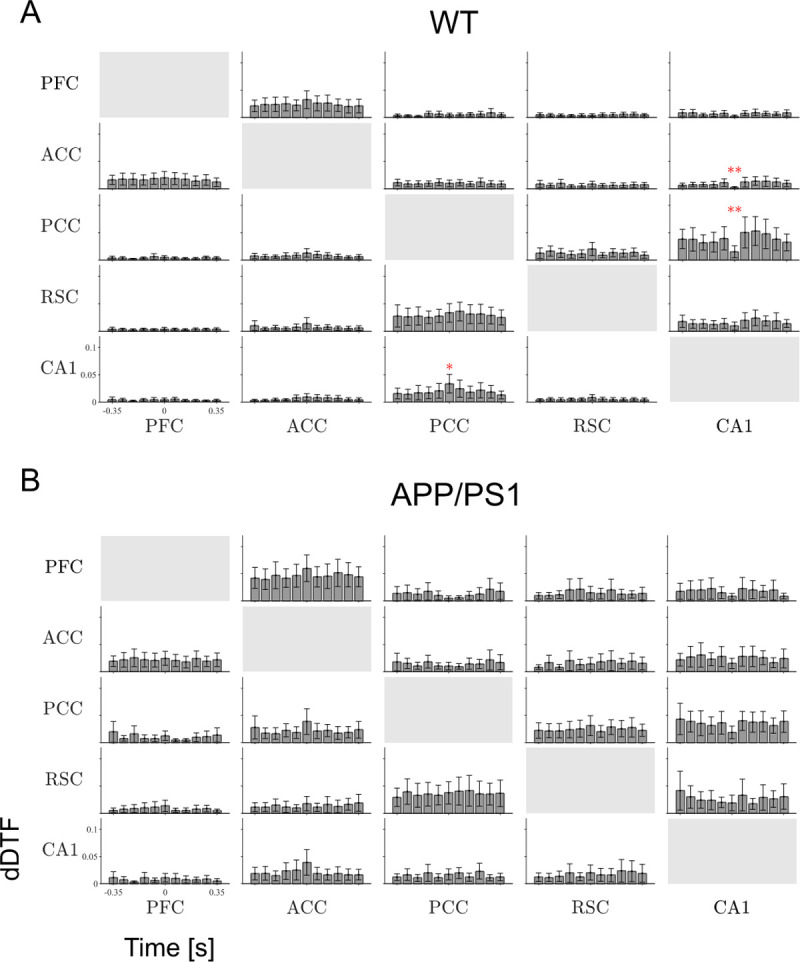
Fig 3. Effective coupling in the slow gamma band.

Time course of dDTF value in the slow gamma (20–60 Hz) band, averaged over WT (A) and APP/PS1 (B) mice. Every box shows mean values of in the slow gamma frequency interval in consecutive time windows. Significant modification of the coupling value compared to the value of the coupling in the first bin is indicated by stars (Wilcoxon’s test with Bonferroni correction). Other abbreviations as in Fig 2. * p < 0.05, ** p < 0.01, *** p < 0.001. Time bin size is 70 ms.
