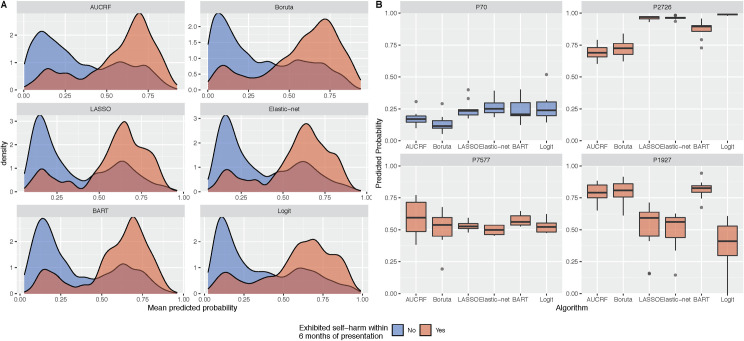
Fig 1. Predicted probabilities of self-harm across the six machine learning algorithms.
Panel A presents the distribution of mean predicted probabilities. The mean predicted probabilities for each patient are averaged across ten repeats of 10-fold cross-validation. Panel B presents the uncertainty in predicted probabilities for a selection of patients. Boxplots show the predicted probabilities across the five algorithms and repeated cross-validation. The predictions for person ID 70 would suggest that the person is highly unlikely to engage in self-harm, in contrast to person ID 2726. In some instances, such as person ID 7577, models could not distinguish whether a person would or would not engage in self-harm as the predicted probabilities are close to 0.5. There are instances where the models will conflict in their predictions (e.g. person ID 1927).

