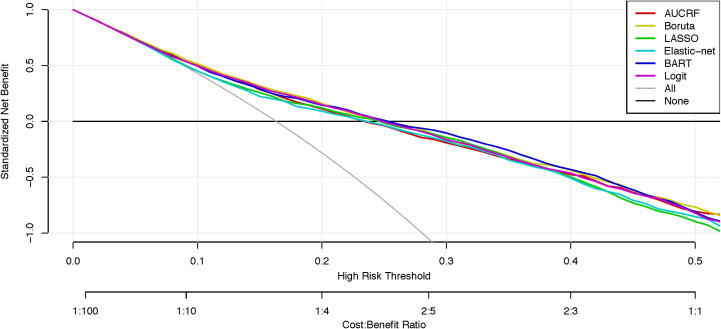
Fig 2. Decision curve analysis of machine learning models predicting self-harm.
Net curves are plotted across a range of probability thresholds for self-harm. The grey line plots the assumption that all people will engage in self-harm (i.e. ‘treat everybody’), whereas the black line assumes that no one will engage in self-harm (i.e. ‘treat no one’). The six coloured lines plot the net benefit of using machine learning models to identify who will engage in self-harm.

