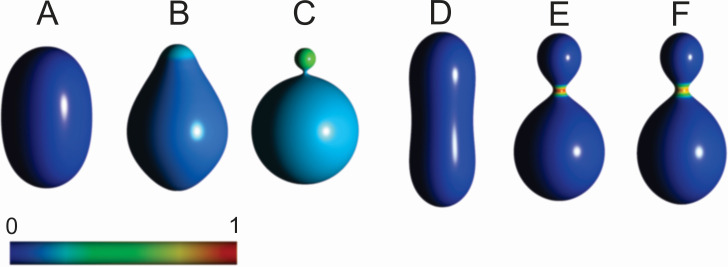
Fig 5. Examples of calculated shapes and respective distributions of constituents in bi-component systems.
In all shapes: k1 = 30 kT, k2 = 240 kB T,R = 250 nm. A-C: The membrane is composed of constituents type 1 that favor isotropic (Fig 2C) mildly curved membrane (dark blue) and constituents type 2 that favor isotropic (Fig 2C) strongly curved membrane (red), h1,m = 1, h2,m = 16, d1,m = d2,m = 0. Relative proportions of type2/type1 constituents are 1 (A), 0.125 (B) and 0.2 (C). D-F: The membrane is composed of type 1 constituents that favor isotropic (Fig 2C) mildly curved membrane and type 2 constitents that favor saddle shaped (Fig 2A) membrane, v = 0.80, h1,m = 2, h2,m = 0, d1,m = 0, d2,m = 8. Relative proportions of total amount of constituents (type 2/type 1) are 0.02 (D), 0.035 (E) and 0.045 (F). Colors representing local relative proportions of constituents are depicted in the scale. The parameters of the calculated shapes are (A): v = 0.95, <h> = 1.0221, <d> = 0.55052, (B): v = 0.95,<h> = 1.0316, <d> = 0.64436, (C): v = 0.95, <h> = 1.1608, <d> = 0.17617, (D) v = 0.80,<h> = 1.1264, <d> = 1.1012, (E): v = 0.80, <h> = 1.2811, <d> = 0.67685, F: v = 0.80, <h> = 1.2760, <d> = 0.73304.

