. 2020 Dec 21;9:e63205. doi: 10.7554/eLife.63205

Figure 1. Y1815F mutation in PlxnA1 induces commissural axon recrossing and disorganized trajectories.

(A) Microphotographs illustrating commissural tracts of PlxnA1+/+ and PlxnA1Y1815F/Y1815F E12.5 open-books labeled with DiI. In PlxnA1+/+ embryos, axons extend straight toward the floor plate (FP), cross the FP, and turn rostrally at the FP exit. In PlxnA1Y1815F/Y1815F embryos, some axons turn back or are misdirected during the navigation of the FP (indicated by green arrows). The FP is delimited by dashed green lines. (B) Quantitative analysis of commissural axon phenotypes (PlxnA1+/+, N = 3 embryos; PlxnA1+/Y1815F, N = 5 embryos; PlxnA1Y1815F/Y1815F, N = 4 embryos). Data are shown as the mean ± s.e.m., Student's t-test has been applied, *: p<0.05. (C) Light sheet imaging of the spinal commissural tracts in PlxnA1+/+ and PlxnA1Y1815F/Y1815F embryos at E12.5, immunostained with anti-Robo3 antibody. Scale bar: 50 μm in (A), 150 μm in (C).

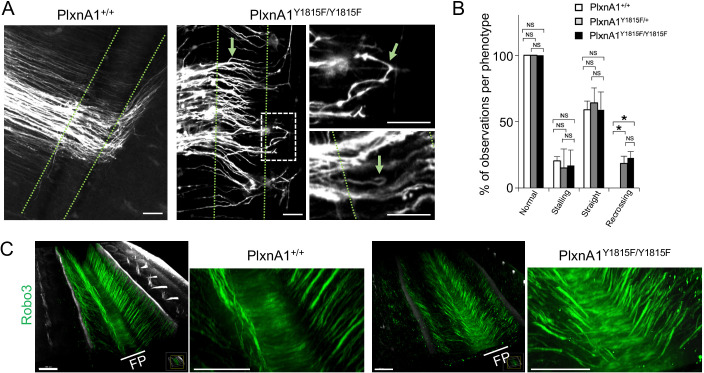
Figure 1—source data 1. Quantitative analysis of commissural axon phenotypes (B).

Figure 1.

Figure 1—figure supplement 1. Generation of PlxnA1Y1815F mutant strain.

Figure 1—figure supplement 1.

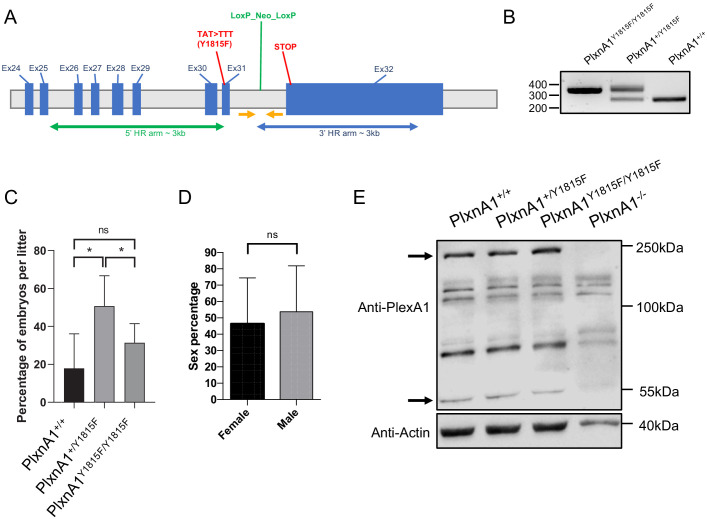
(A) Schematic representation of the PlxnA1Y1815F allele. The selection cassette encoding neo is inserted in the region spanning exons 25–32. The homolog arms are indicated in 5′ and 3′. TAT >TTT (Y1815F) mutation is inserted in introns 30 and 31. The genotyping primers are indicated as yellow arrows. (B) Genotyping PCR products: the genotyping primers indicated in (A) amplify a 341 bp fragment from the mutated allele (PlxnA1Y1815F/Y1815F) and a 262 bp fragment from the wild-type (PlxnA1+/+) allele. (C) Percentage of mice with each genotype coming from PlxnA1Y1815F/+× PlxnA1Y1815F/+ crossing (N = 8 litters, 46 mice total). (D) Overall percentage of female and male mice (N = 41 litters, 220 mice total). Data are shown as the mean ± s.d., Student's t-test has been applied, *: p<0.05. (E) Representative electrophoresis of spinal cord lysates prepared from E12.5 PlxnA1-/-, PlxnA1+/+, PlxnA1+/Y1815F, and PlxnA1Y1815F/Y1815F embryos, immunoblotted with anti-PlxnA1 and anti-actin antibodies. PlxnA1 is detected under two major forms, the integral form at 250 kDa and a short form at 55 kDa. Black arrows point the 250 kDa form present at higher rate and the 55 kDa form present at lower rate in the PlxnA1Y1815F condition, compared to the other genotypes.
Figure 1—figure supplement 1—source data 1. Percentage of mice with each genotype coming from PlxnA1Y1815F/+× PlxnA1Y1815F/+ crossing (C).
Figure 1—figure supplement 1—source data 2. Overall percentage of female and male mice (D).
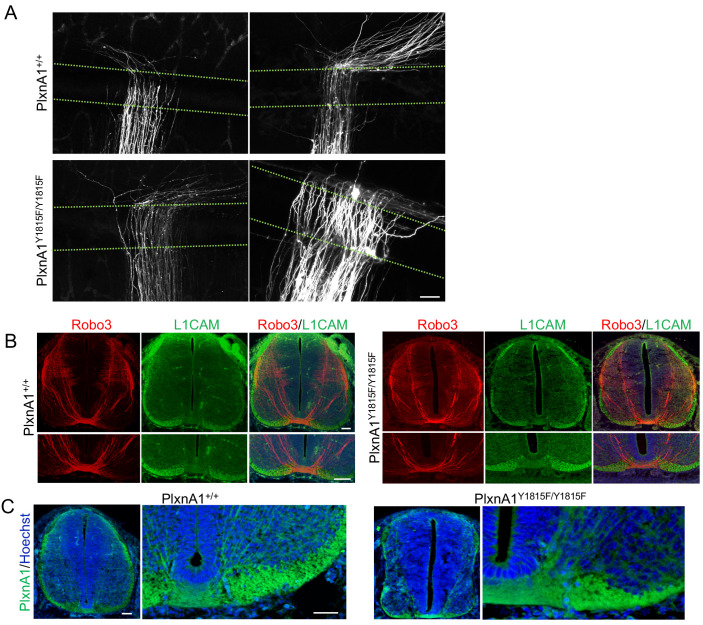
Figure 1—figure supplement 2. DiI traced commissural axon trajectories in PlxnA1Y1815F embryos are disorganized in the floor plate (FP) but not obviously prior to the crossing.

Figure 1—figure supplement 2.

(A) Microphotographs illustrating commissural tracts of PlxnA1+/+ and PlxnA1Y1815F/Y1815F E12.5 open-books labeled with DiI, showing disorganized growth in the FP. The FP is delimited by dashed green lines. Scale bar: (B) Immunofluorescent labeling of Robo3 and L1CAM in transverse cryosections from E12.5 embryos in PlxnA1+/+ and PlxnA1Y1815F/Y1815F spinal cords. (C) PlxnA1 immunolabeling on E12.5 transverse sections of PlxnA1+/+ and PlxnA1Y1815F/Y1815F embryos at E12.5. Scale bar: 50 μm in (A–C).