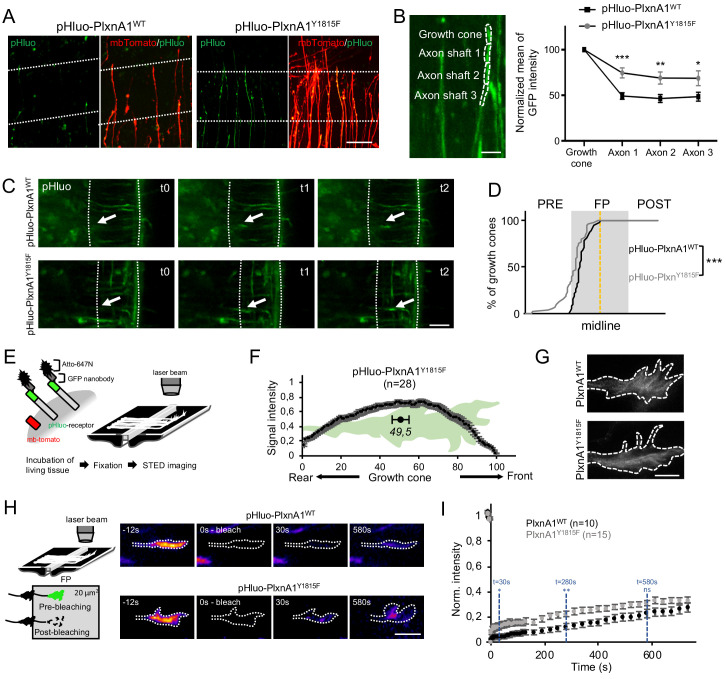
Figure 3. The Y1815F mutation alters the spatio-temporal pattern of cell surface PlxnA1 distribution and membrane mobility at the growth cone.
(A) Microphotographs of commissural axons navigating the floor plate (FP) in living open-books of electroporated PlxnA1-/- mice embryos. The FP is delimited by dashed white lines. (B) Method of quantification and quantification of the pHluo signal (PlxnA1WT, N = 6 embryos, 24 growth cones; PlxnA1Y1815F, N = 4 embryos, 18 growth cones). Data are shown as the mean ± s.e.m., Student's t-test has been applied, *: p<0.05, **: p<0.01, ***: p<0.001. (C) Microphotographs of live imaging movies illustrating the sorting of PlxnA1 receptor at the surface of commissural growth cones navigating the FP (delimited by dashed white lines). (D) Cumulative fractions of growth cones that sort PlxnA1 to their surface, reported by the pHluo fluorescence, in electroporated chick embryos (pHluo-PlxnA1WT, N = 2 embryos, 38 growth cones; pHluo-PlxnA1Y1815F, four embryos, 53 growth cones). KS test has been applied, ***: p<0.001. (E) Schematic representation of the paradigm of STED imaging in open-books. (F) Quantification of the center of mass of the signal (N = 28 growth cones from five embryos). Data are shown as the mean ± s.e.m. (G) STED microscopy images of pHluo-PlxnA1Y1815F cell surface distribution in commissural growth cones navigating the FP. (H) Schematic representation of the paradigm of fluorescence recovery after photobleaching (FRAP) experiments. Representative color-coded images from video-time lapse sequences illustrating photobleaching and fluorescence recovery. (I) Graphs of fluorescence recovery for pHluo-PlxnA1WT and pHluo-PlxnA1Y1815F (PlxnA1WT, N = 2 embryos, 10 growth cones; PlxnA1Y1815F, N = 2 embryos, 15 growth cones). Data are shown as the mean ± s.e.m., Student's t-test has been applied at t = 30 s, t = 280 s, and t = 580 s, ns: non-significant, *: p<0.05, **: p<0.01. Scale bars: 5 μm in (G), 10 μm in (B and H), 50 μm in (A and C).


