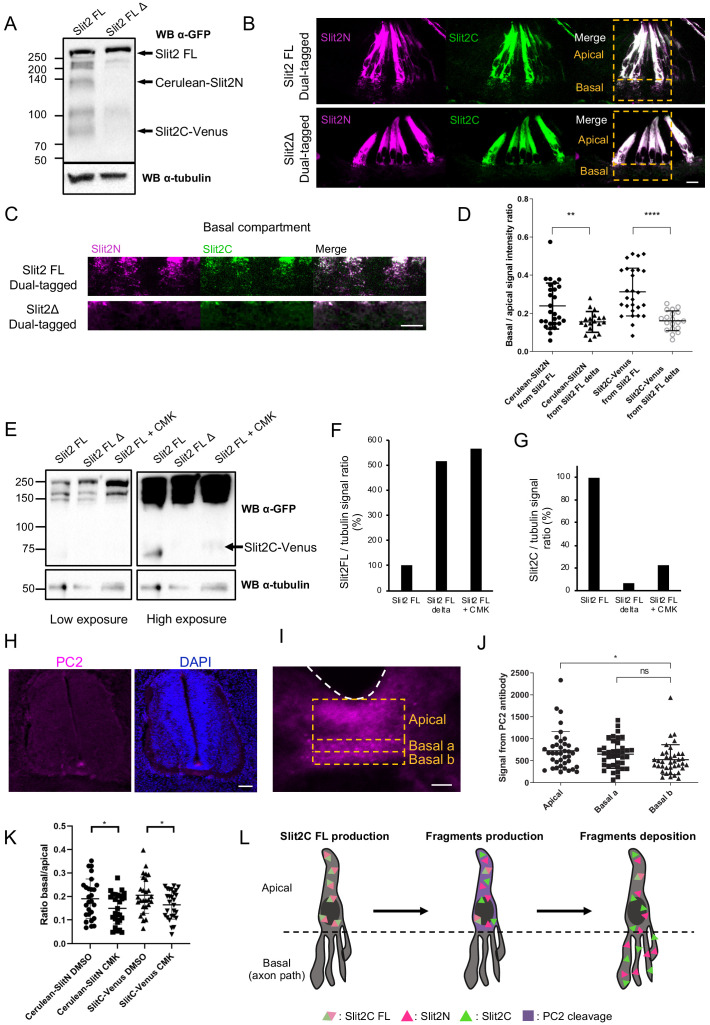
Figure 6. Slit2-FL cleavage plays a role in the proper diffusion of the protein and is dependent on PC2.
(A) Western blot detection of Cerulean and Venus in N2a cells transfected with either dual-tagged Slit2-FL or the uncleavable dual-tagged Slit2-FL Δ. An anti-green fluorescent protein (GFP) antibody was used, which recognizes Cerulean and Venus, two GFP derived fluorescent proteins. Protein sizes are in kDa. (B) Thick transverse sections of E4 chick spinal cord floor plate (FP) electroporated with dual-tagged Slit2-FL or dual-tagged Slit2-FL Δ (uncleavable form deprived from the cleavage site generating Slit2N and Slit2C fragments). (C) Close-up of the basal domains from (B). (D) Intensity ratio of the basal compartment over the apical compartment for Cerulean and Venus in FP electroporated with dual-tagged Slit2-FL or dual-tagged Slit2-FL Δ. (E) Western blot detection of Cerulean and Venus in N2a cells transfected with either dual-tagged Slit2-FL or the uncleavable dual-tagged Slit2-FL Δ and treated with PC2 inhibitor CMK. Tubulin is used as a loading control. (F and G) Ratio of the intensity of the Slit2-FL band (F) or the Slit2C band (G) over the intensity of tubulin band. (H) Immunofluorescent labeling of E4 chick spinal cord transverse sections using an antibody targeting PC2 (left panel) and DAPI (right panel). (I) Close-up of the PC2 labeling in the FP. (J) Quantification of the PC2 labeling in the three compartments delineated by yellow dashed lines. (K) Quantification of Slit2C and Slit2N basal/apical signal in control DMSO and CMK injected embryos after dual-tagged Slit2-FL electroporation. (L) Schematic representation of Slit2 fragments generation and deposition from the cleavage of Slit2-FL by PC2 in FP glial cells. Data are shown as the mean ± s.d. in (D and J) and Student's t-test has been applied. ns: non-significant, *: p<0.05, ***: p<0.001. Scale bars = 10 μm in (B, C, and I), 80 μm in (H).

