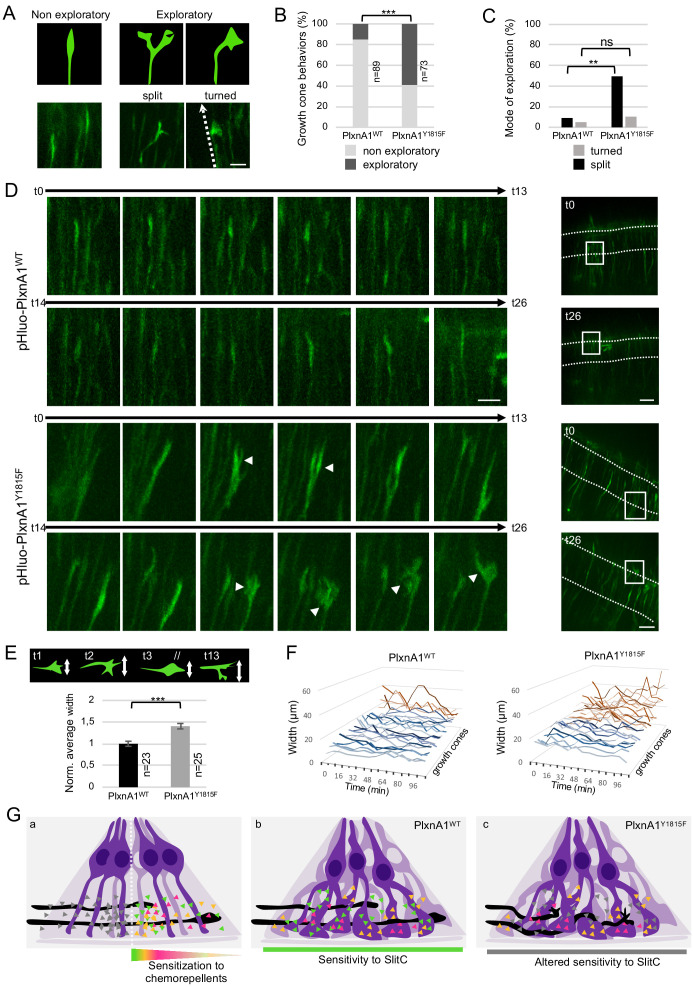
Figure 7. PlxnA1Y1815F commissural growth cones have an increased exploratory behavior exerted through morphological split.
(A) Analysis of growth cone behaviors with fast time-lapse sequences. Schematic representation of growth cone categories and microphotographs of representative growth cones. (B) Histogram of the quantification of exploratory growth cones in PlxnA1WT and PlxnA1Y1815F open-books (pHluo-PlxnA1WT, N = 5 electroporated embryos, 89 growth cones; pHluo-PlxnA1Y1815F, N = 3 electroporated embryos, 73 growth cones). Chi-squared test has been applied, ***: p<0.001. (C) Histogram depicting the mode of exploration adopted by PlxnA1WT and PlxnA1Y1815F growth cones. The percentage was calculated over the total growth cone population (pHluo-PlxnA1WT, N = 5 electroporated embryos, 89 growth cones; pHluo-PlxnA1Y1815F, N = 3 electroporated embryos, 73 growth cones). Chi-squared test has been applied between non-exploratory and split populations (**: p<0.01), and between non-exploratory and turned (ns: non-significant). (D) Time-lapse sequences of individual growth cones navigating the floor plate (FP). The right panels show growth cone positions at time 0 and time 26. Time interval: 8 min. (E) Quantification of growth cone width reporting their exploratory behavior during the FP navigation in PlxnA1WT and PlxnA1Y1815F open-books (pHluo-PlxnA1WT, N = 4 electroporated embryos, 23 growth cones; pHluo-PlxnA1Y1815F, N = 3 electroporated embryos, 25 growth cones). Data are shown as the mean ± s.e.m., Student's t-test has been applied, ***: p<0.001. (F) Histograms of individual growth cone width (μm) from t = 0 min to t = 122 min (pHluo-PlxnA1WT, N = 4 electroporated embryos, 23 growth cones; pHluo-PlxnA1Y1815F, N = 3 electroporated embryos, 25 growth cones). (G) Current and proposed novel model of the mechanisms ensuring proper midline crossing of spinal cord commissural axons. Scale bars: 10 μm in (A and D, left), 50 μm in (D, right).


