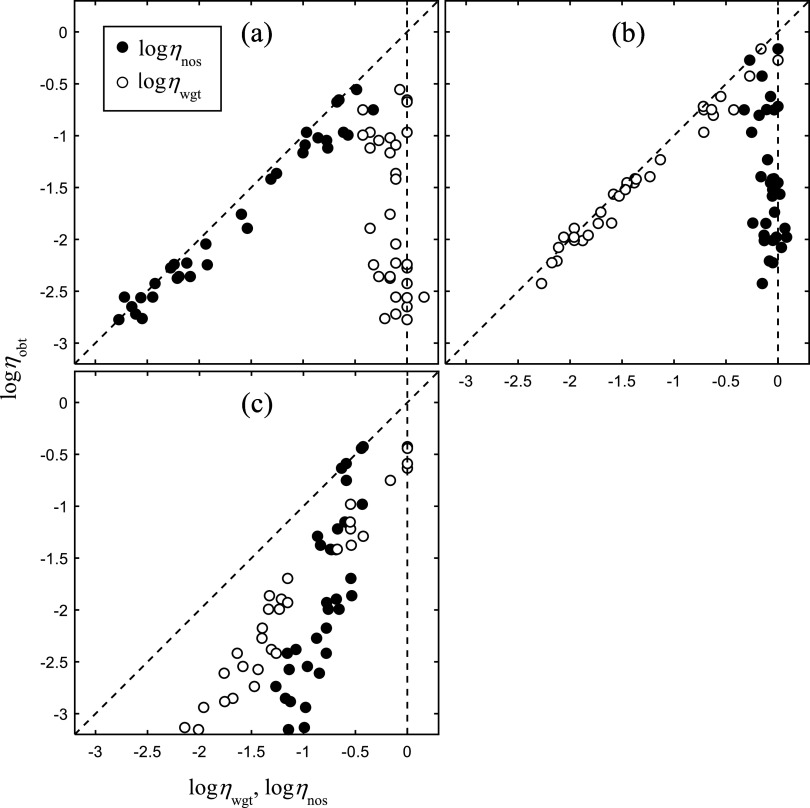
FIG. 1.
Results of computer simulation. Overall performance efficiency ηobt is plotted against weighting efficiency ηwgt (unfilled symbols) and internal noise efficiency ηnos (filled symbols) with the different symbols representing the data from the different hypothetical listeners. The values of η are expected to fall between the two dashed lines shown. Simulations are for individual differences in internal noise (a), decision weights (b), and an interaction between decision weights and internal noise (c).

