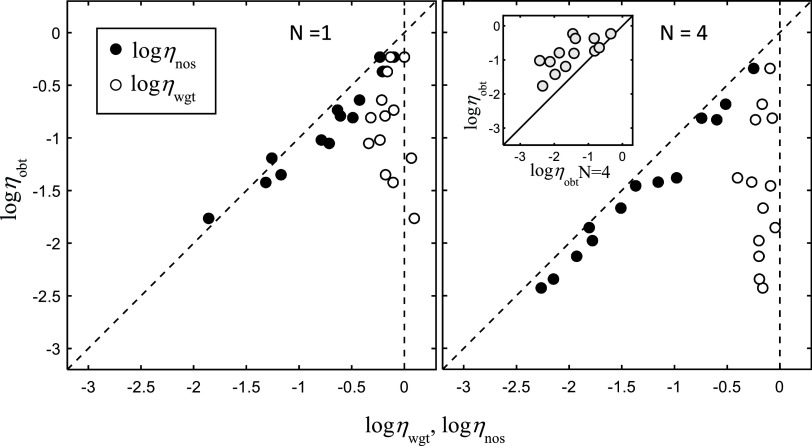
FIG. 5.
Data for seven listeners (replications for six) participating in the segregation task for N = 1 and 4 vowel triplets (panels), η values plotted as before. The inset in the right panel compares directly the overall performance efficiencies, ηobt, obtained in the two conditions across the two replications.

