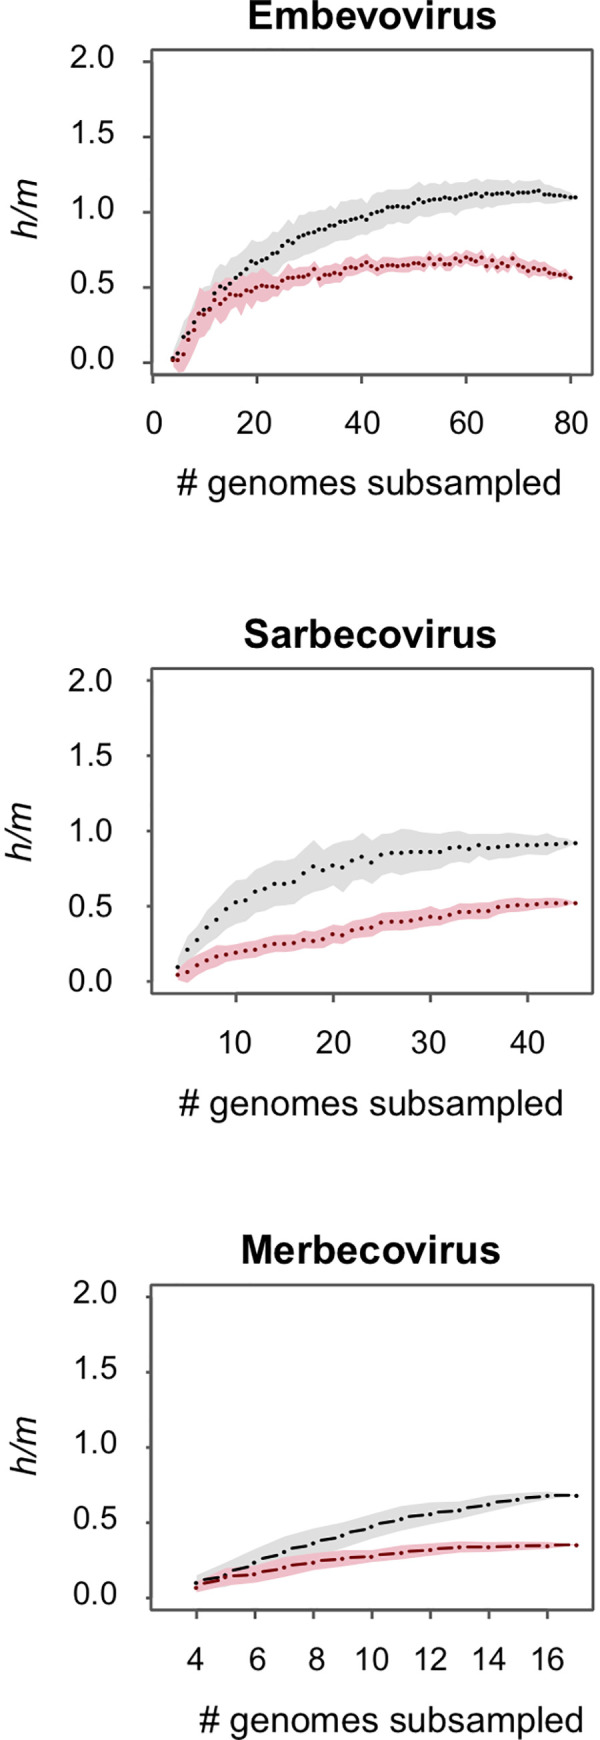
Fig 1. Detecting recombination within Betacoronavirus subgenera based on ratios of homoplastic (h) to non-homoplastic (m) polymorphisms.

Within each bivariate plot, black dots and the grey-shaded area denote the median and standard deviation of h/m values of the indicated number of subsampled combinations of genomes; and red dots and pink-shaded area denote the median h/m values and standard deviation for simulated data in which all homoplasies are introduced by convergent mutations. Differences between the distributions of observed and simulated h/m values indicate the extent to which polymorphisms are attributable to recombination. Analyses were performed on the three subgenera for which genomes were sampled to sufficient depths to provide robust results.
