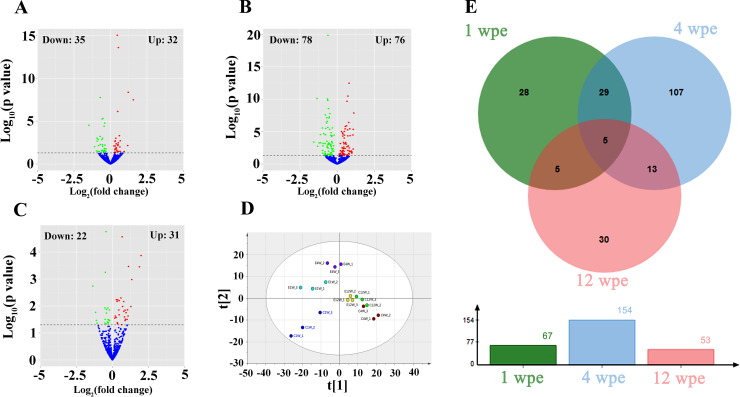
Fig 2. Summary of the distribution of DEmiRNAs.
(A-C) Volcano plots of DEmiRNAs at 1, 4 and 12 wpe, respectively. (D) PLS-DA plot of miRNA profiles at 1, 4 and 12 wpe. (E) Venn plot of DEmiRNAs at 1, 4 and 12 wpe. Log2 (Fold change) = Log2(Relative expression of treated liver/ Relative expression of non-treated liver).

