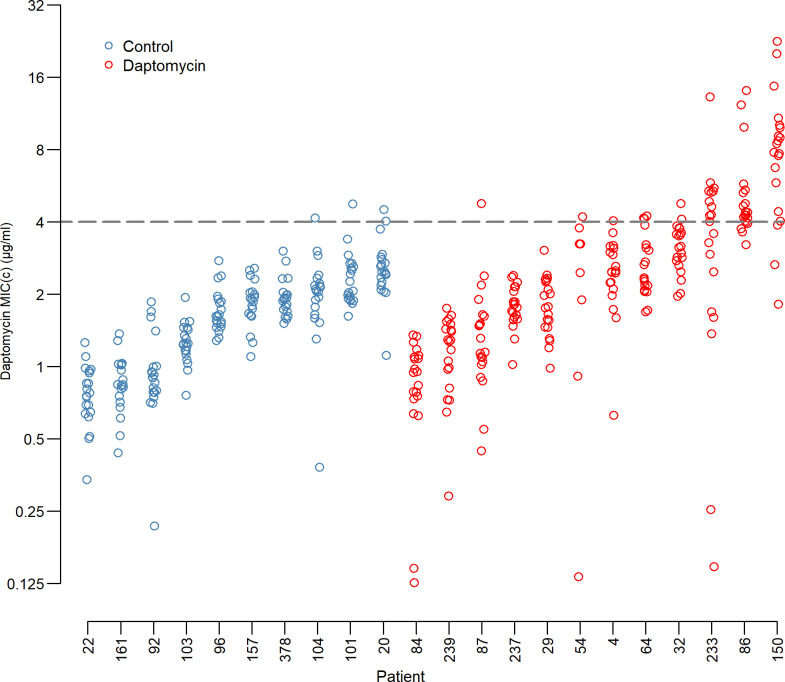
Fig 3. Daptomycin MICs by patient.
Daptomycin resistance of each clone by patient and exposure group. Blue circles are the control patients and red circles are from daptomycin-exposed patients. Each circle is the mean of 2 independent estimates of the MICC for a single clone. Clones above the dashed line are daptomycin resistant (due to the continuous nature of the computed MIC (MICC), an MICC of >4μg/ml is equivalent to the clinical 2-fold MIC cutoff of ≥8μg/ml (see Methods for a more detailed discussion of the MICC method)). The underlying data for this figure can be found in S1 Data.

