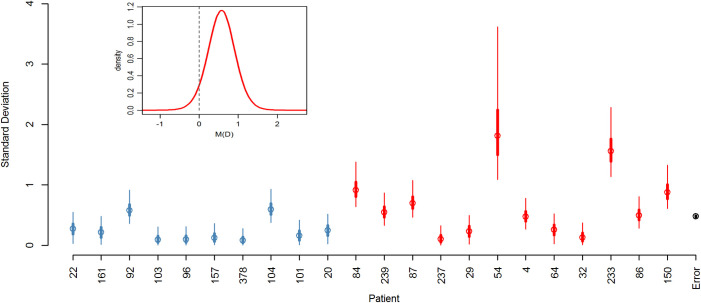
Fig 4. Posterior distribution of random and fixed effects from the Bayesian mixed effects model.
(Main panel) Posterior distributions for standard deviations of the clones within patients and the error. Blue markers indicate control patients, red indicate daptomycin-treated patients, and black is the error (circle: mean; thick lines: 50% credibility interval; thin lines: 95% credibility interval). The 95% credibility interval of the error falls within the error marker. (Insert) Posterior distribution of fixed effect for prior daptomycin exposure. The underlying data for this figure can be found in S1 Data.

