
Figure 4.
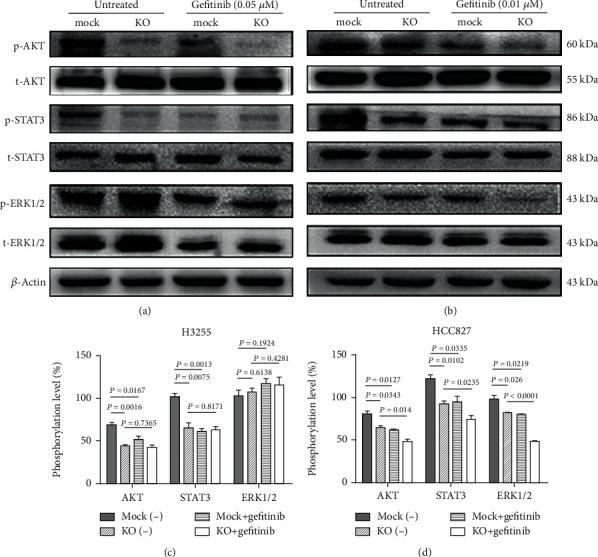
B7-H3-induced signaling in H3255 and HCC827 cells. B7-H3 KO/mock H3255 (a) and HCC827 (b) cells were left untreated or treated with 0.05 μM and 0.01 μM gefitinib, respectively, and cell lysates were assayed for the expression of total and phosphorylated AKT, STAT3, and ERK1/2 by western blotting. These experiments were triplicated, and the representative images are shown. (c, d) Relative protein phosphorylation level ((p−/t−)∗100%) between groups. β-Actin was used as the reference protein. Data were mean ± SEM of three independent experiments.