
Figure 3.
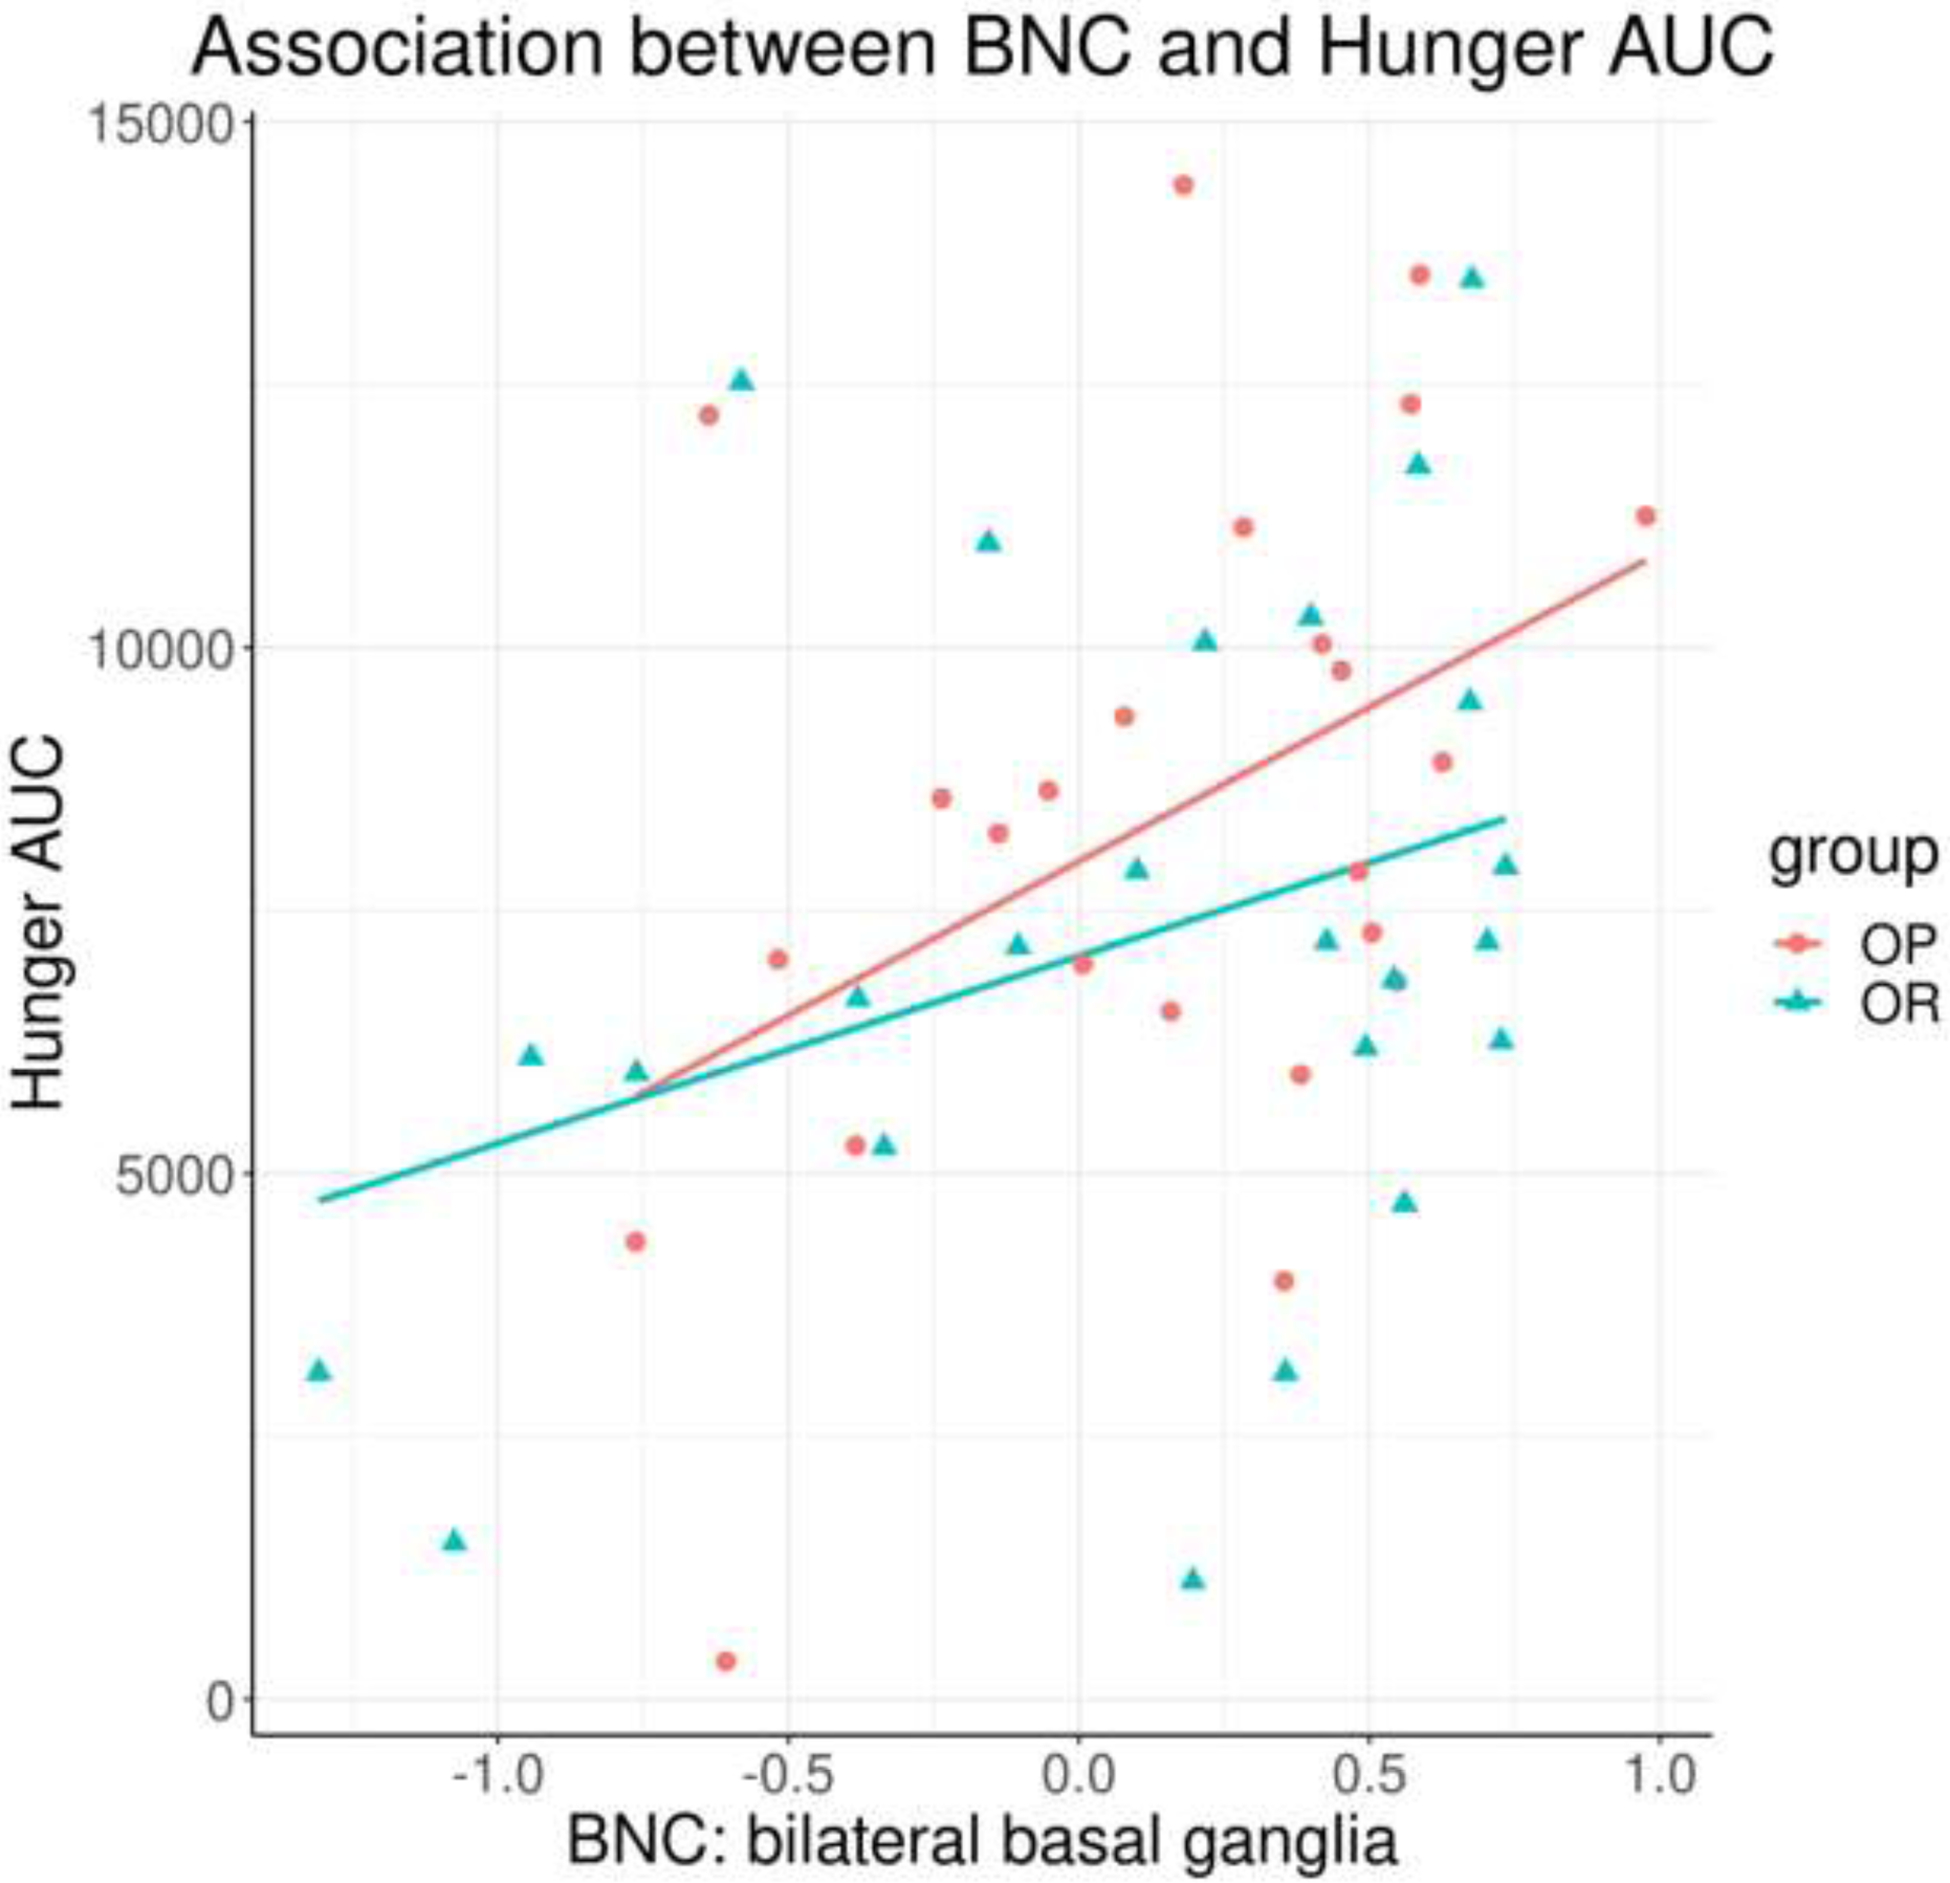
Significant positive correlation between basal ganglia BNC and hunger AUC (p = 0.008), across all participants. BNC = between-network connectivity; AUC = area under the curve.
Official websites use .gov
A
.gov website belongs to an official
government organization in the United States.
Secure .gov websites use HTTPS
A lock (
) or https:// means you've safely
connected to the .gov website. Share sensitive
information only on official, secure websites.
Significant positive correlation between basal ganglia BNC and hunger AUC (p = 0.008), across all participants. BNC = between-network connectivity; AUC = area under the curve.