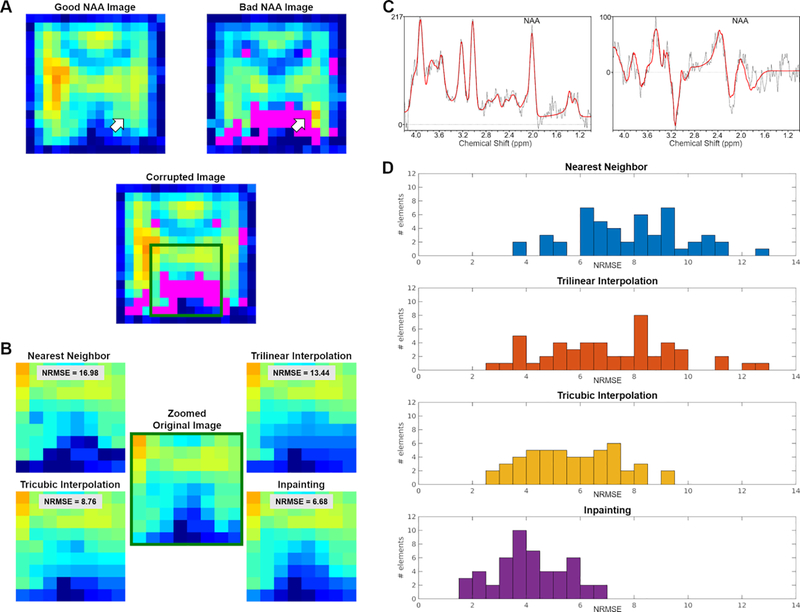
Figure 3.
(A) Examples of a “good NAA CSI image” (left) and a “bad NAA CSI image”, showing in magenta a significant proportion of voxels not meeting QC threshold (right). Below is the result of imposing the mask from the “bad image” (in magenta) onto the “good image”. (B) Zoomed view displaying details of the images restored using the various methods and their performance to maintain the ground truth distribution. (C) Spectra and fittings corresponding to a “good voxel” (left) and a “bad voxel” (right) pointed by the white arrows in panel A. (D) Histogram of NRMSE distribution for the four different methods. NRMSE are binned in 0.5 wide bins.

