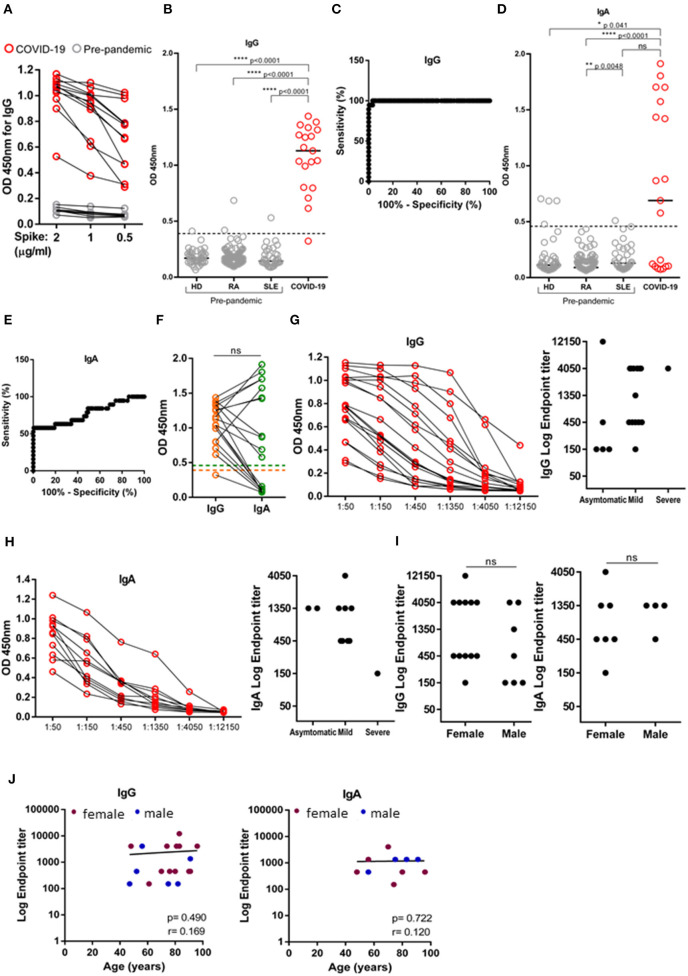
Figure 1.
Validation of SARS-CoV-2 ELISA assay. Levels IgG and IgA against trimeric spike protein of SARS-CoV-2 measured in the serum of SARS-CoV-2 PCR-positive individuals (n = 19) and pre-pandemic donors (n = 216) by absorbance at 450 nm (OD450). (A) Titration of trimeric Spike protein coating at 2, 1 and 0.5 μg/mL by measuring IgG OD450 of 12 SARS-CoV-2 PCR-positive individuals (red) and eight pre-pandemic controls diluted at 1:50 (gray). (B) Comparison of IgG levels between 19 SARS-CoV-2 PCR-positive individuals (red) and three pandemic cohorts: healthy donors (HD, n = 43), rheumatoid arthritis (RA, n = 138) and systemic lupus erythematosus (SLE, n = 35), diluted at 1:50. Dashed line indicates test cut off. (C) ROC analysis plotting specificity against sensitivity of samples as in (B). (D) Comparison of IgA levels between 19 SARS-CoV-2 PCR-positive individuals (red) and three pandemic cohorts: healthy donors (HD, n = 43), rheumatoid arthritis (RA, n = 138) and systemic lupus erythematosus (SLE, n = 35), diluted at 1:50. Dashed line indicates seropositivity threshold. (E) ROC analysis plotting specificity against sensitivity of samples as in (D). (F) Donor matched OD450 values for IgG and IgA of serum SARS-CoV-2 PCR-positive individuals diluted at 1:50. Dashed line indicate, orange: IgG seropositivity threshold, green: IgA seropositivity threshold. (G) Serial dilution for anti-spike IgG (left) and anti-Spike IgG endpoint titers (right) according to disease classification (severe, mild and asymptomatic). (H) Serial dilution for anti-spike IgA (left) and anti-Spike IgA endpoint titers (right) according to disease classification (severe, mild and asymptomatic). (I) Anti-Spike IgG and IgA endpoint titers in SARS-CoV-2 PCR-positive individuals segregated by sex. (J) Levels of IgG and IgA endpoint titers against age (females-maroon; males-blue). Data show individual sample values. P-values ****p < 0.0001, **p < 0.01, *p < 0.05 were determined by Kruskal-Wallis test (B,D), Wilcoxon test (F), Man-Whitney test (I) and Spearman test (J).

