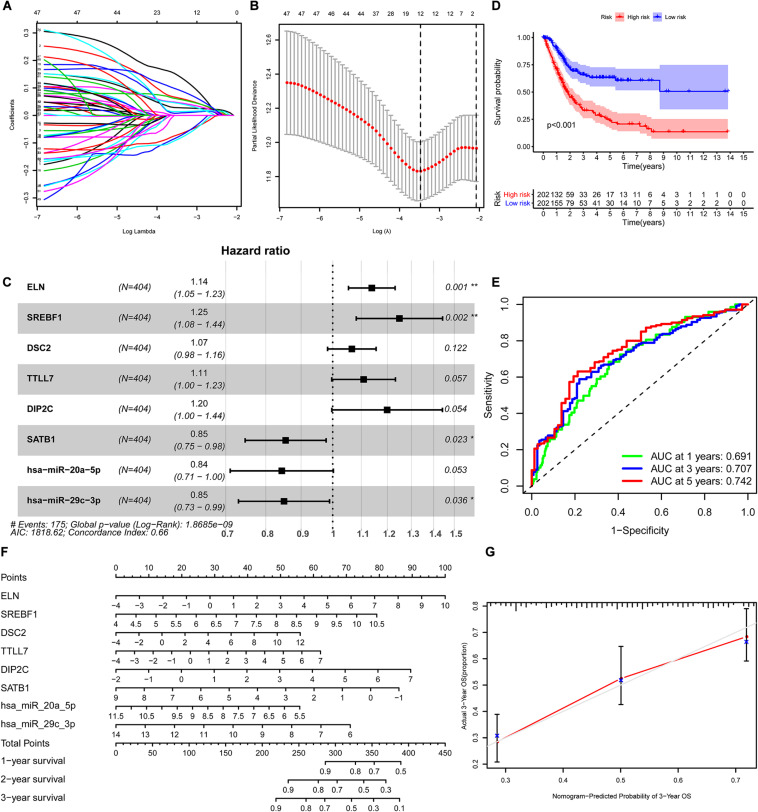
FIGURE 4.
Construction of the nomogram for predicting the survival probability of BLCA based on the identified hub genes in ceRNA networks. The results of the Lasso regression (A,B); the forest plot of the multivariate Cox regression analysis (C); the Kaplan–Meier survival curve in high- and low- risk groups based on the multivariate Cox regression analysis (D); the ROC curves of the multivariate Cox model (E); the nomogram (F) and its calibration curve (G). BLCA, bladder cancer; ceRNA, competing endogenous RNA; ROC, Receiver Operating Curve.

