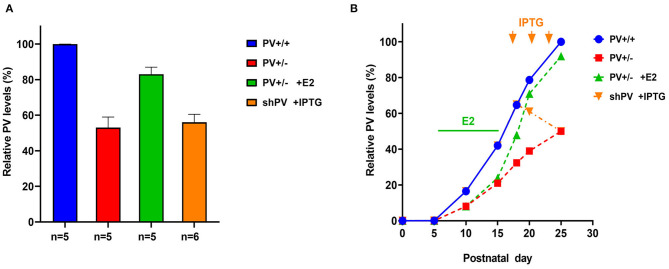
Figure 2.
(A) Relative parvalbumin (PV) expression level determined by semi-quantitative western blot analysis in mouse forebrain extracts from PND25. Data for PV+/+ (defined as 100%), PV+/−, and PV+/− mice treated with E2 are from Filice et al. (2018); data for isopropyl-β-d-thiogalactoside (IPTG)-treated shPV mice are from Filice et al. (2019). The number of mice is indicated; values represent mean ± SD. (B) Autism spectrum disorder (ASD)-like behavior shown in Figures 3, 4 was tested at PND25 in four conditions/genotypes: (1) wild-type (WT) mice; (2) constitutive PV+/− mice; (3) PV+/− rescue mice, in which PV expression was enhanced by E2 treatment; and (4) shPV22 (downregulation) mice, in which IPTG treatment at PND18, PND21, and PND24 reduced PV level to 50–60% of that in WT mice at PND25. PV expression profile (solid blue line) in WT (PV+/+) mice is based on data obtained from protein extracts of mouse cerebellum (Collin et al., 2005). In PV+/− mice (red line), the level was assumed to be ~50% that of WT mice at all time points. Treatment of PV+/− mice with E2 from PND5 to PND15 (green bar) results in a PV level that is ~90% of that in WT mice at PND25 (green line). Treatment of transgenic shPV22 mice with IPTG at PND18, PND21, and PND24 (orange arrows) decreases PV level to ~50% of that in WT mice at PND25 (orange line). As the precise course of PV expression in the three groups is not yet supported by experimental data, the lines are dashed. However, relative PV expression level at PND25 corresponds to the experimental data shown in (A). As previously reported, IPTG treatment alone (at PND18, PND21, and PND24) had no effect on PV expression levels at PND25 as determined using the shTurboGFP control transgenic mouse line (Filice et al., 2019).

