
Figure 5.
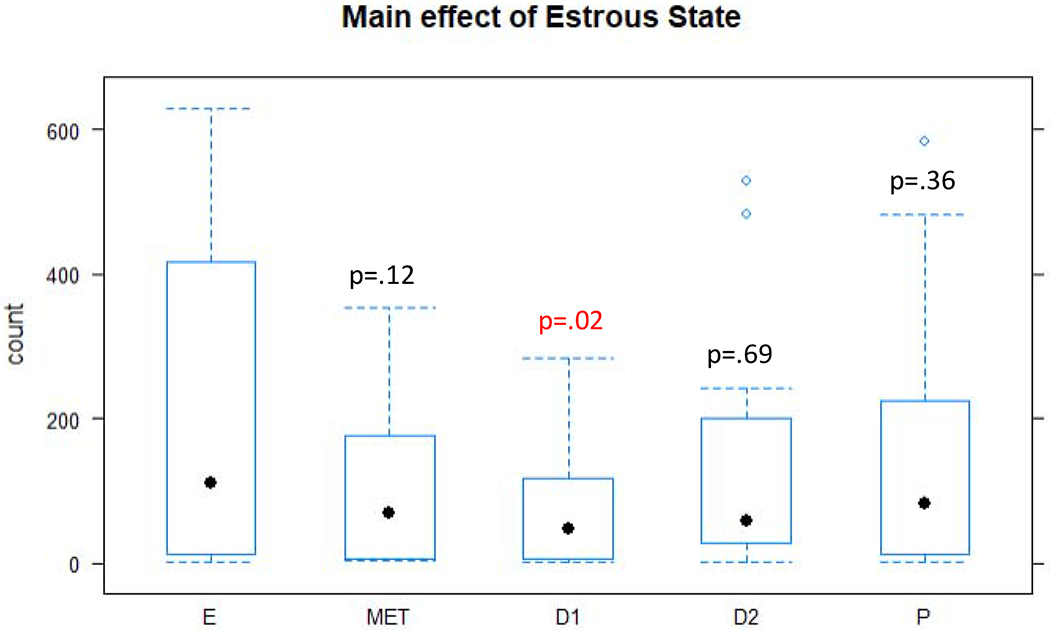
Box and whisker plots of the number of USVs produced in the five estrous states. P-values represent pairwise comparisons between the estrus stage and the other estrous stages. E= estrus, D1=diestrus I, D2=diestrus II, MET=metestrus, and P=proestrus.