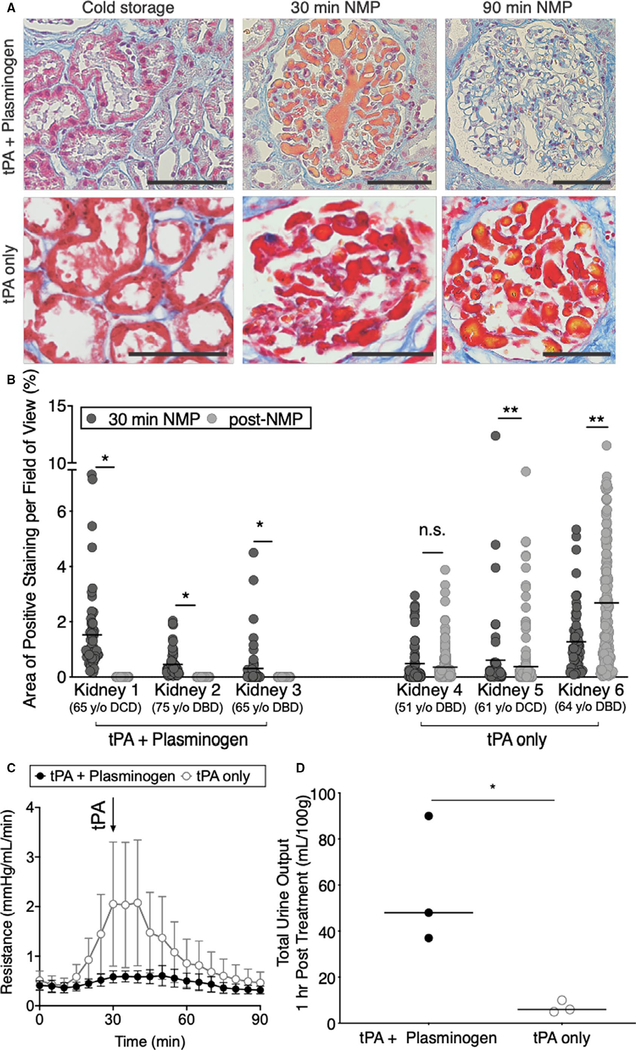
FIGURE 3.
Combined tissue plasminogen activator (tPA) + plasminogen treatment lyses microvascular obstructions. A, Representative images and B, quantification of area of microvascular obstruction are shown for single kidneys treated with tPA + plasminogen or tPA only (*P < .0001, **P < .05; Mann-Whitney t test). Scale bars represent 100 μm. C, Resistance time traces as measured during normothermic machine perfusion (NMP) for tPA + plasminogen treated kidneys vs tPA only controls. Data points represent the mean and error bars signify standard error of the mean for each group of 3 kidneys. Arrow denotes point of tPA administration. D, Total urine output normalized to the mass of each kidney as measured after 90 min of NMP (*P = .0340; unpaired t tests). Data points represent individual kidneys

