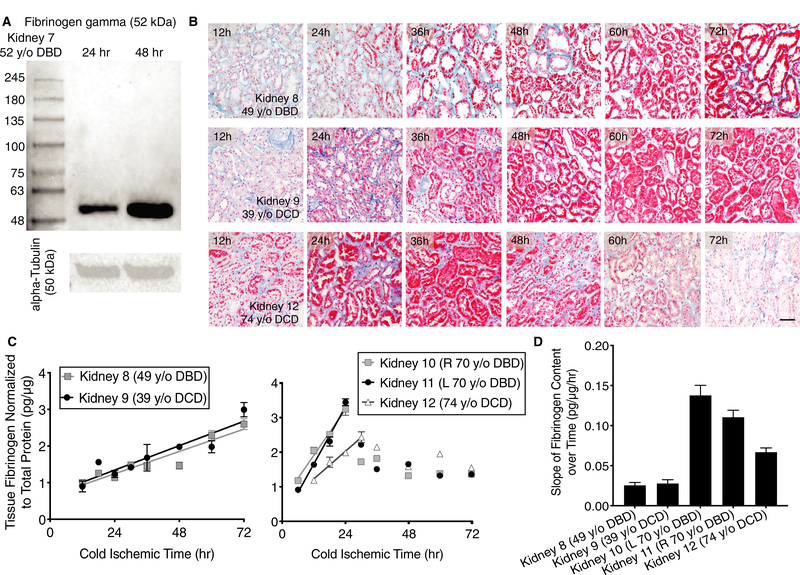
FIGURE 5.
Tubular epithelia produce fibrinogen during cold storage at variable rates depending on the donor. A, Western blot depicting levels of fibrinogen gamma subunit and alpha-Tubulin loading controls from Kidney 7 at 24 and 48 h. B, Representative images of sections taken from repeat biopsy of a 49 y old donor after brain death (DBD), 39 y old donor after cardiac death (DCD), and 74 y old DCD kidneys over the course of 72 h. Martius scarlet blue (MSB) stain shows increasing fibrinogen accumulation in tubular epithelia during cold-storage (red). Scale bar represents 100 μm. C, Fibrinogen ELISAs performed on tissue lysates from repeat biopsies in 5 kidneys from 4 separate donors taken over the course of 72 h (left—younger donors; right—older donors). Lines represent a fit to the linear phase of fibrinogen production. D, Rate of fibrinogen production for each organ as derived from linear fits in (C). Error bars refer to standard deviation. All measurements were performed in technical triplicate

