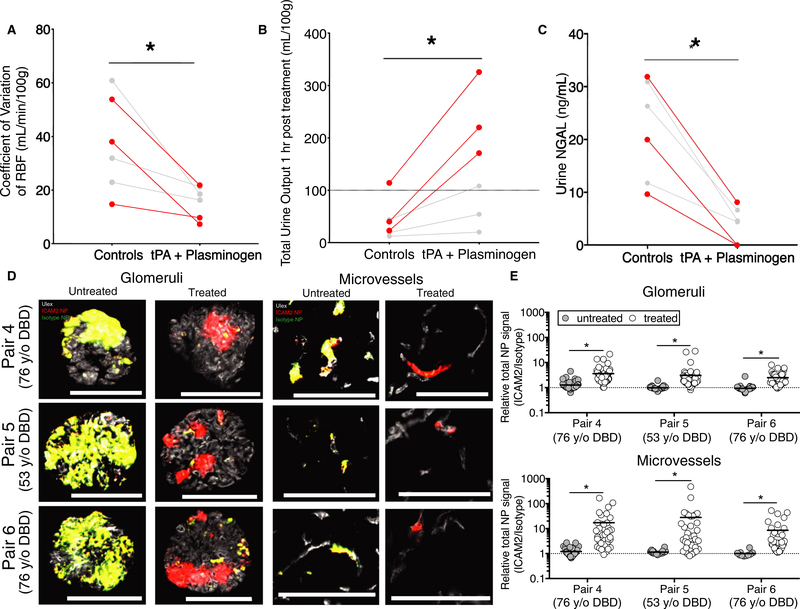
FIGURE 6.
Lysing vascular obstructions improves specificity of vascular-targeted nanoparticles (NPs). A, Variation in renal blood flow (RBF) in tPA + plasminogen treated organs relative to paired controls as measured over the final 60 min of normothermic machine perfusion (NMP) (*P = .0126; paired t test). Each data point represents a single kidney and lines connect paired organs. Red data points and lines are from Pairs 4–6 that were stored for prolonged cold times of 30–36 h to build high fibrinogen levels. Gray data points and pairs refer to Pairs 1–3. B, Total urine production (*P = .0157; paired t test) and C, NGAL levels (*P = .0023; paired t test) over the final 60 min of NMP in treatment vs control groups. D, Representative images of glomeruli (left) and microvessels (right) from paired kidneys receiving either tissue plasminogen activator (tPA) + plasminogen treatment (treated) or NMP alone (untreated) prior to injection of combined intercellular adhesion molecule 2 (ICAM2)-NPs and Isotype-NPs labeled with 2 separate fluors (ICAM2-NPs, red; Isotype-NPs, green; NP-overlay, yellow; Ulex, white). E, Quantification of relative NP signal (ICAM2-NPs/Isotype-NPs) after 4 h of NP circulation. Each data point represents a separate image of either interstitial microvessels (top) or glomeruli (bottom); nonspecific (1:1) accumulation is represented by a dashed line (*P < .0001 Wilcoxon signed-rank test). Three separate sections were evaluated per kidney with 20 images per section collected for 60 images total per kidney. Scale bars represent 100 μm

