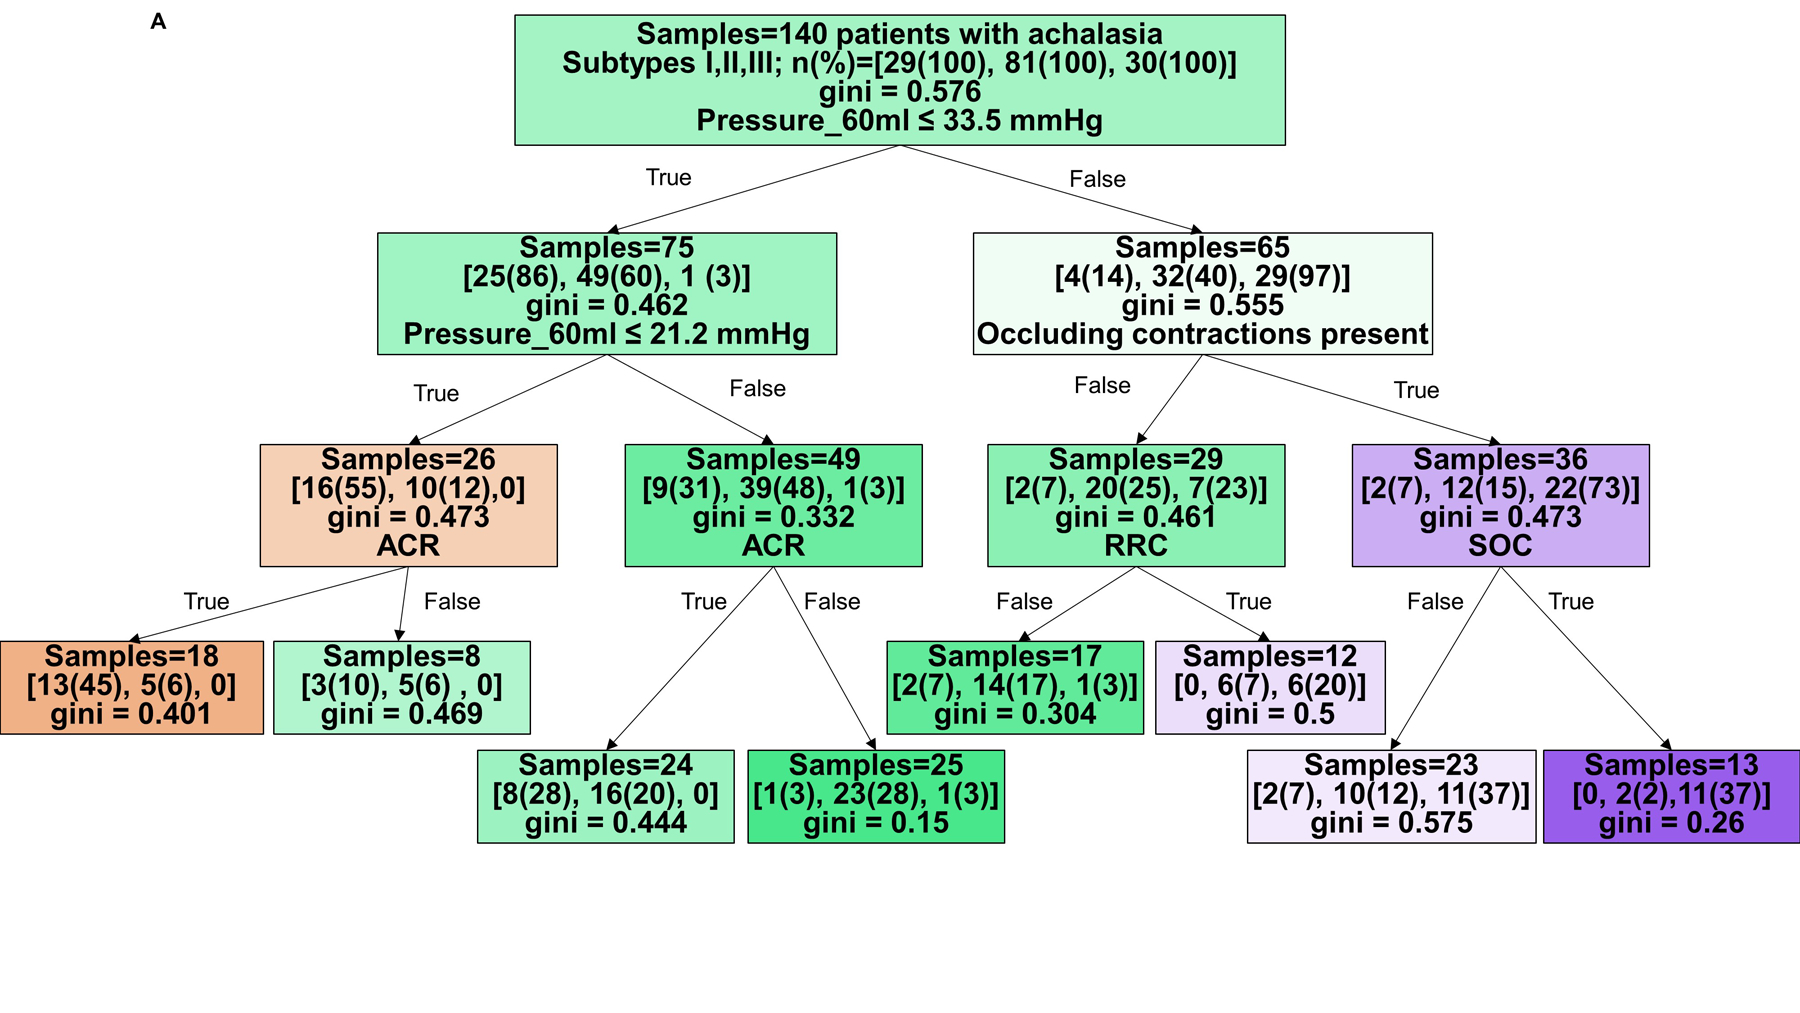
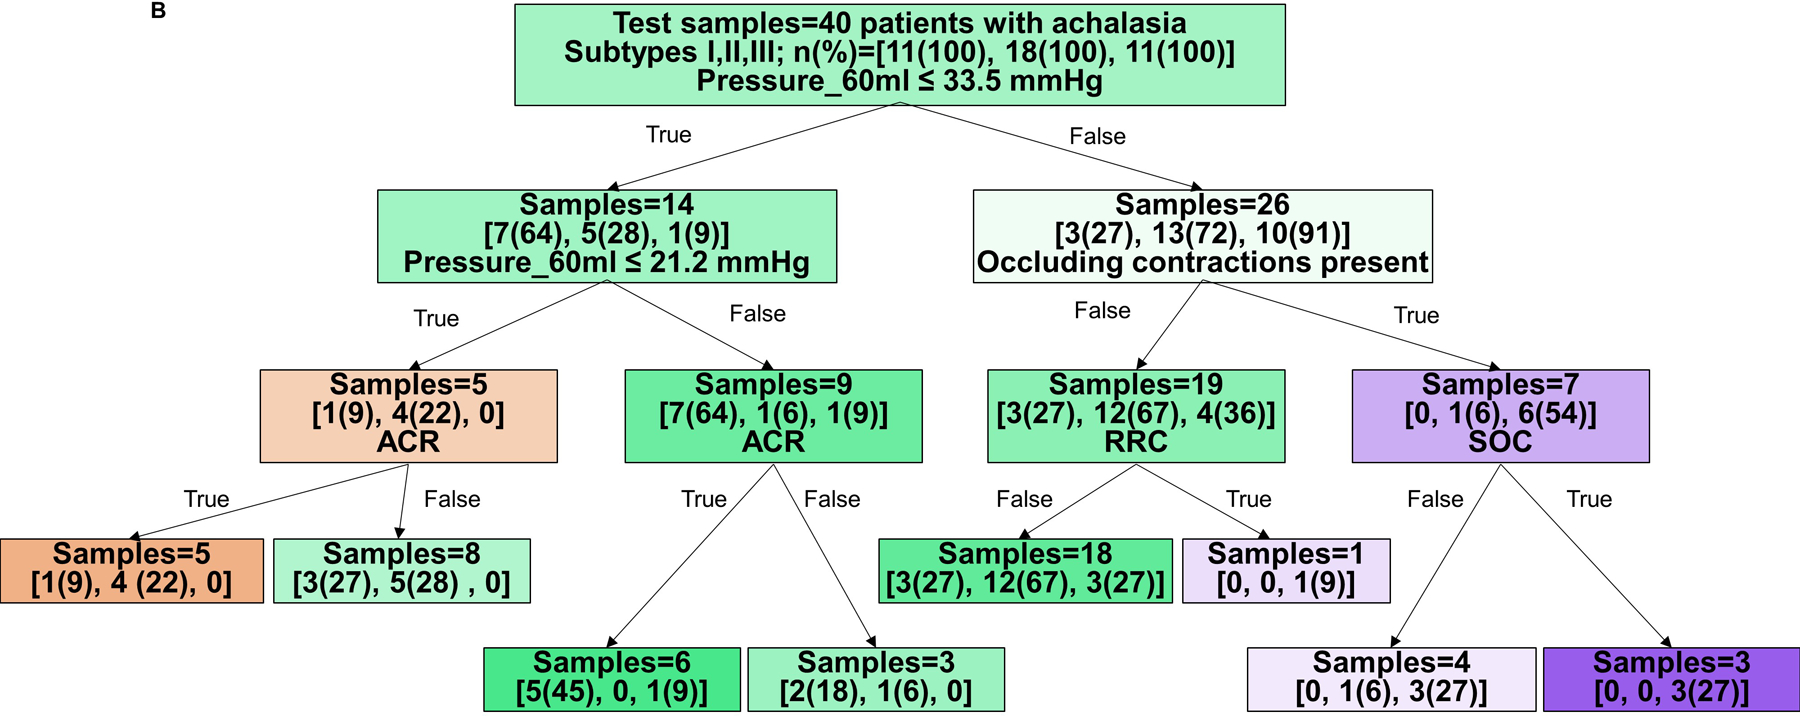
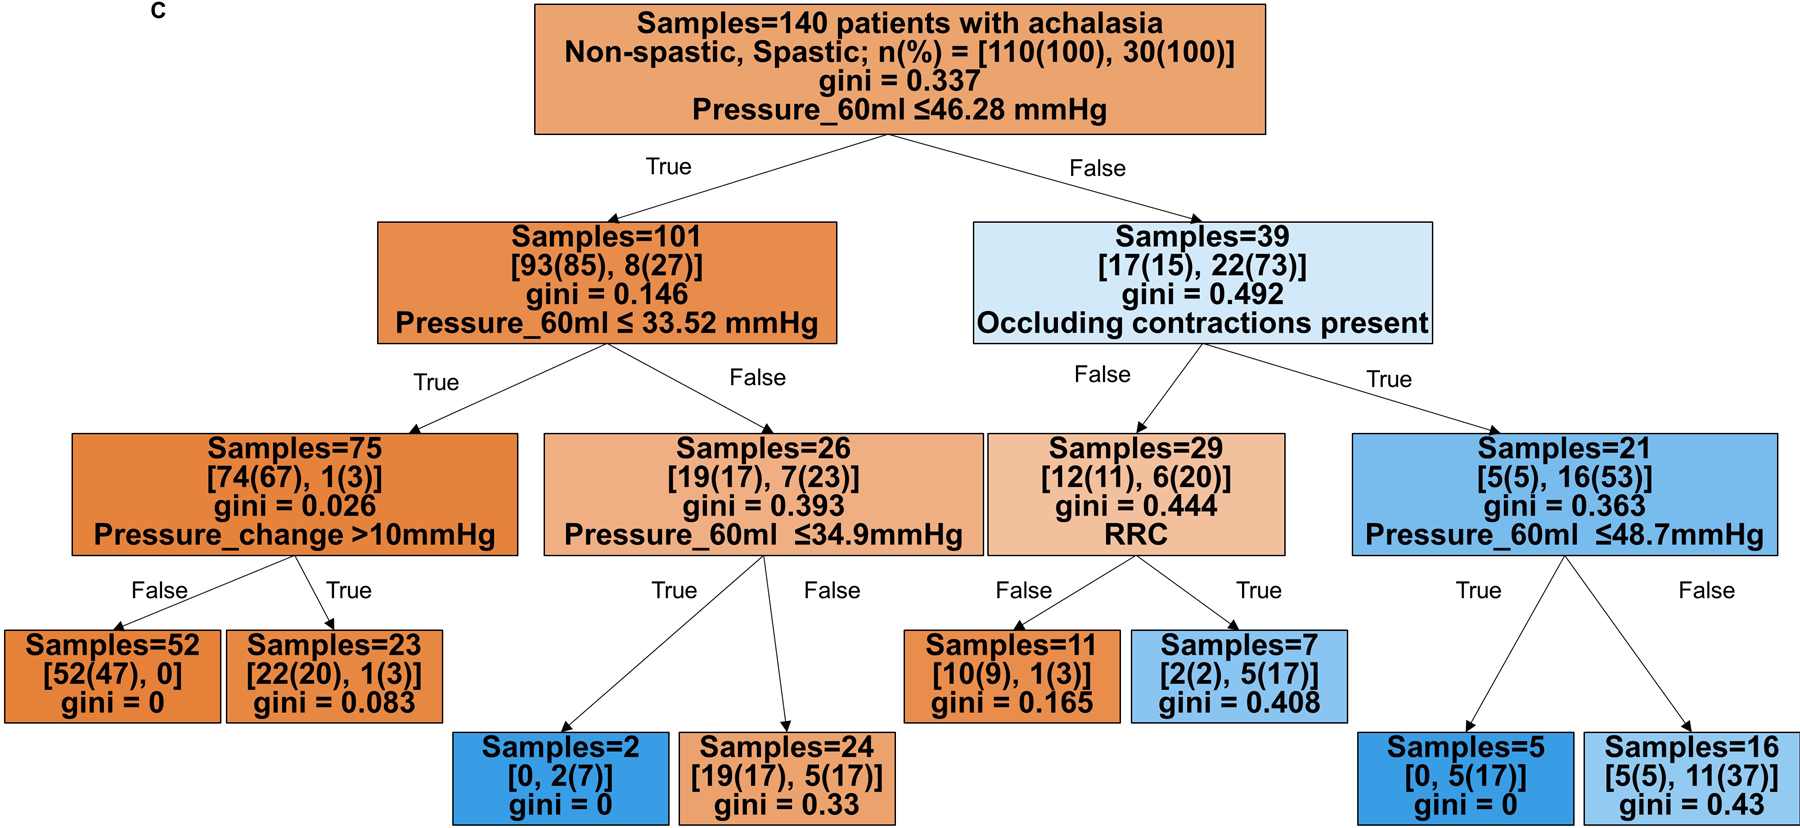
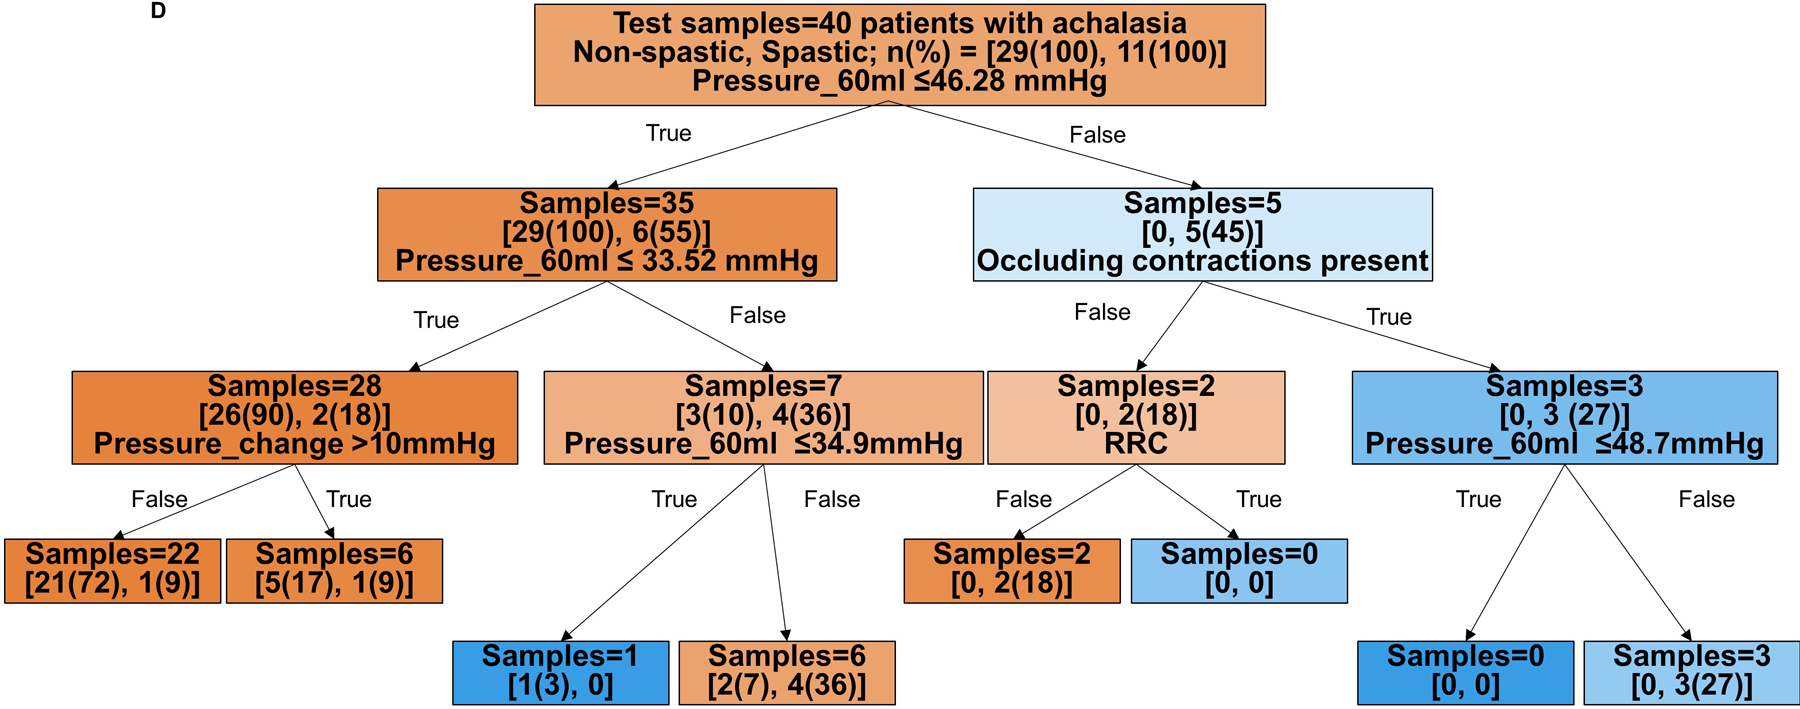
Figure 2. Tree models for prediction of HRM achalasia subtypes by FLIP panometry.


Branch points are color coded by HRM classification. The intensity of shading indicates the ‘impurity’ within that branch point and gini indicates the decrease in node impurity related to the variable derived from the training cohort. A and B) Prediction for HRM subtypes: I vs II vs III. The training cohort is reflected in A and the test cohort in B. Branch points are color coded by predicted HRM subtype with orange for type I, green for type II, and purple for type III. The number of patients per achalasia classification are indicated by [n(%) type I; n(%) type II; n(%) type III]. C and D) Prediction of non-spastic vs spastic achalasia subtypes. Branch points are color coded by predicted HRM subtype with orange for non-spastic achalasia (subtypes I and II) and blue for spastic (type III) achalasia. The number of patients per classification are indicated by [n(%) non-spastic, n(%) = spastic]. ACR – absent contractile response. RRC – repetitive retrograde contractions. SOC – sustained occluding contractions. Figure used with permission from the Esophageal Center at Northwestern.
