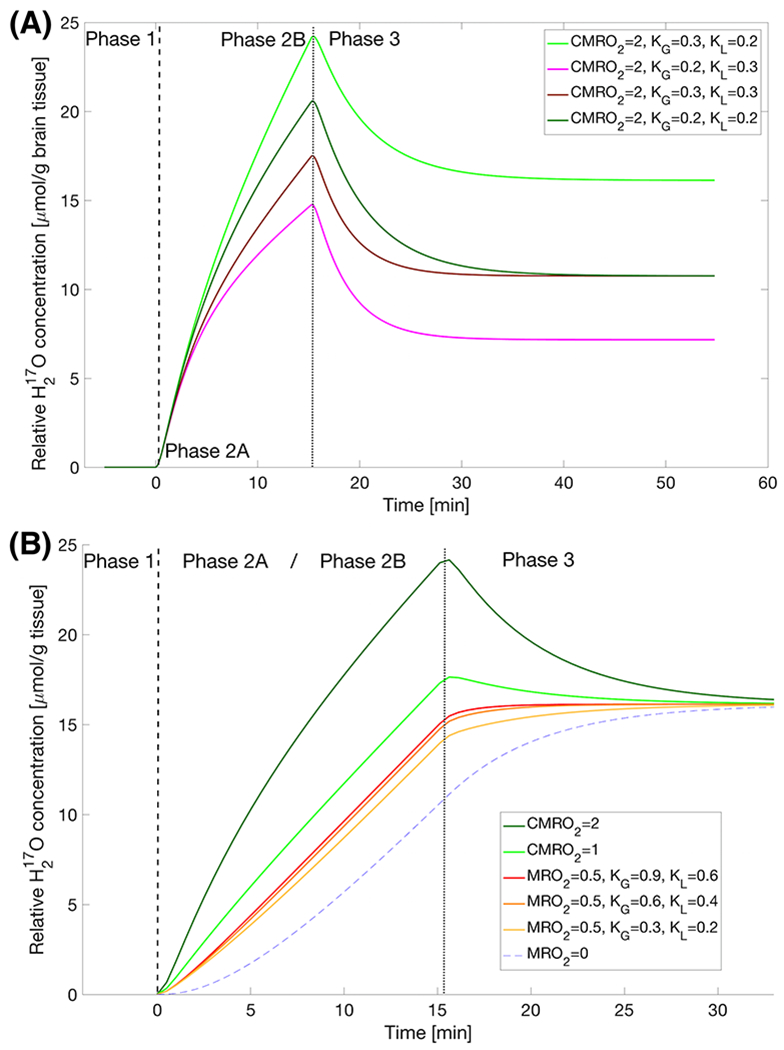
FIGURE 3.

(A) A simple iso-metabolic comparison of varying degrees of perfusion and circulatory parameters (i.e., the KG and KL parameter values) using the three-phase model (Eqn.[1]) highlighting phases in high metabolizing tissue: Phase 1 - pre-inhalation natural abundance H217O; Phase 2 - during inhalation with initial increases dominated by locally produced H217O (Phase 2A as the first ~2-4 min) and subsequently varied slopes (especially in later Phase 2B) from the different perfusion and circulation parameters; Phase 3 – post-inhalation H217O with varying washout rates to reach equilibrium levels that were linearly affected by the KG / KL ratio at the same local metabolic rate.
(B) Zoomed (~2x) in time three-phase model plots at different metabolic rates: during the first few minutes, the H217O water content in low metabolizing tissue increases much slower than that in the higher ones (Phase 2A), signals approach a similar slope during Phase 2B and at the end of the inhalation, the H217O in low metabolizing tissue continues to rise with gradually decreased slope; both high and low metabolizing tissue approach the same equilibrium due to recirculation of body water at a new steady-state level determined by the global metabolic rate (VO2, according to Eqn. [2]). Unless otherwise stated in the legend, all time courses in (B) had KG=0.3 and KL=0.2.
The dashed and dotted lines indicate the beginning and end of the Phase 2, respectively.
