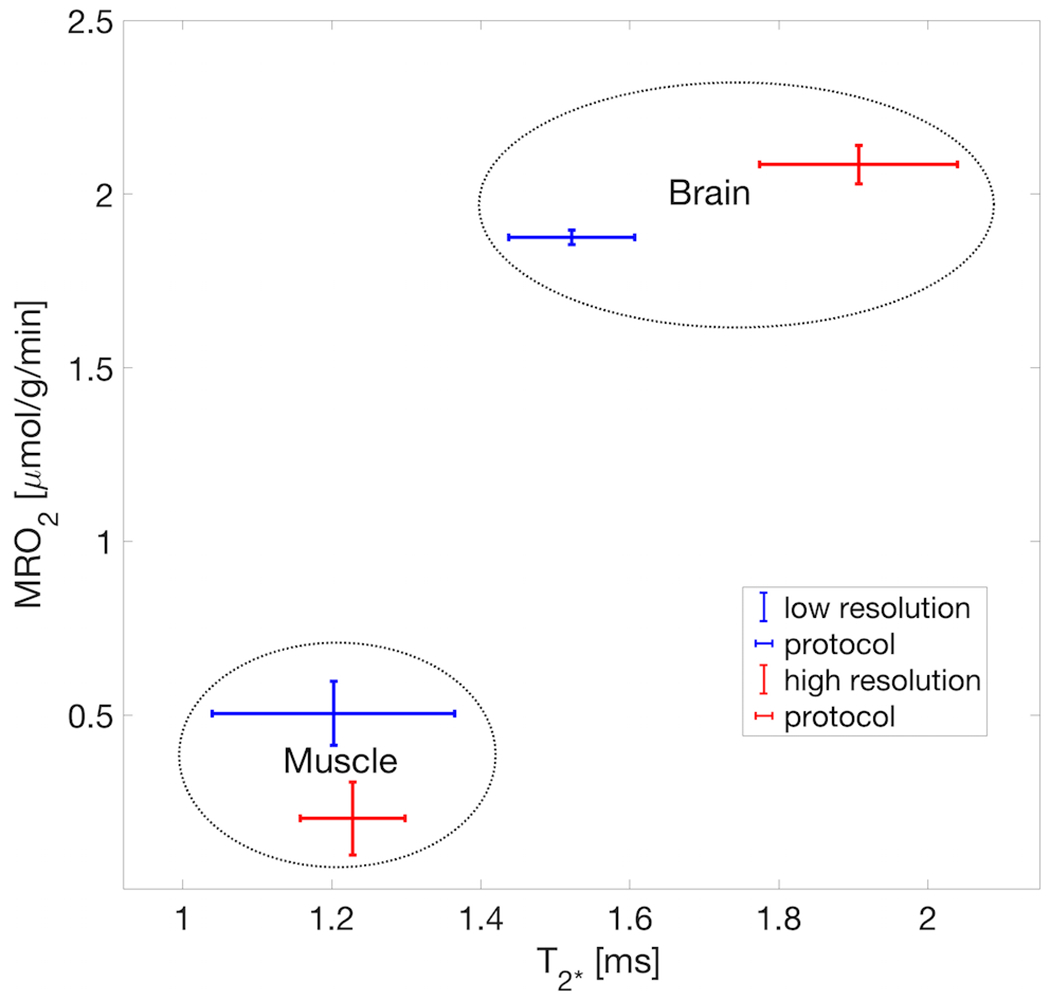
FIGURE 5.

Scatter plot of in-vivo tissue T2* vs. metabolic rate showing high correlation in both tissue types of brain and muscle from clearly separated clusters of the independent properties of metabolic rate and relaxometric behavior inside ROIs. The distinction benefits from the fact of a stark difference in T2* as also previously reported for both in vivo and post-mortem tissues. Each cluster is based on the pooled tissue type of two representative rats (rat A and rat G), of each high resolution and low resolution protocols, respectively. Note: this is only an observation to confirm the accurate selection and size (i.e. partial volume contamination) of the ROIs and does not imply a causal relation between relaxation rate and metabolic rate in either direction.
