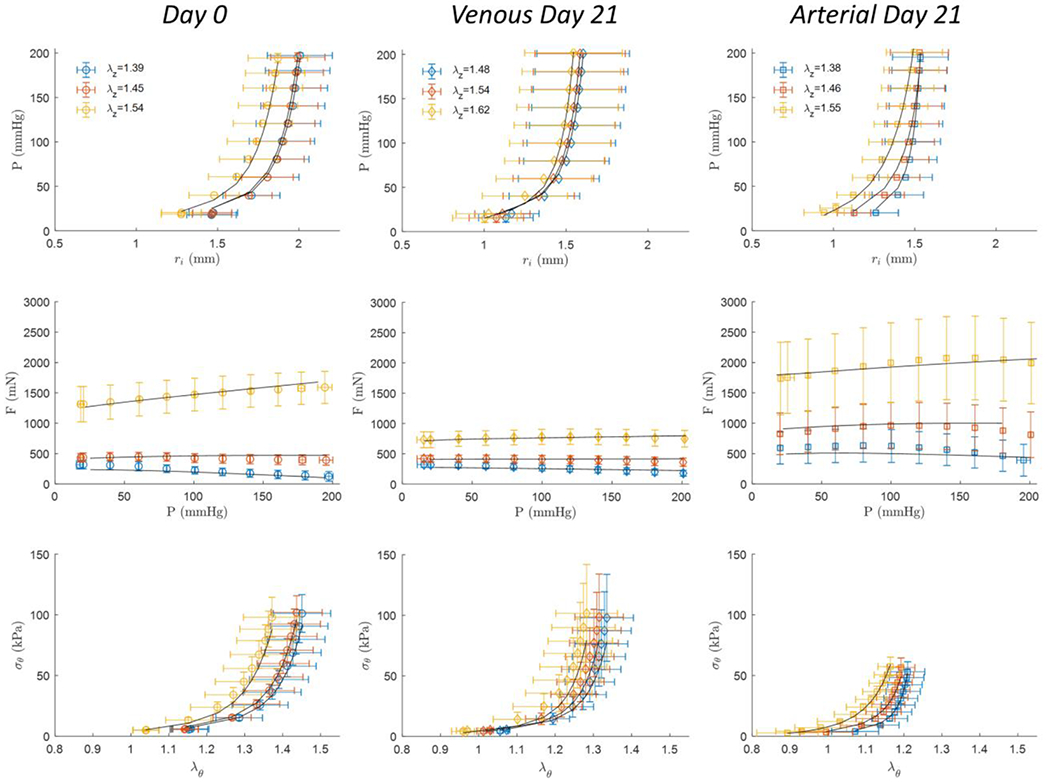
Figure 3.

Biaxial mechanical testing results of GSVs (left) at Day 0 (n=10), or after 21-days of (middle) Venous (n=4), or (right) stepwise Arterial (n=6) perfusion culture conditions. All measured data represent mean values ± the standard deviation and are shown at (red), above (yellow), and below (blue) the in vivo axial stretch ratio. Black curves illustrate data fitted to the constitutive model.
