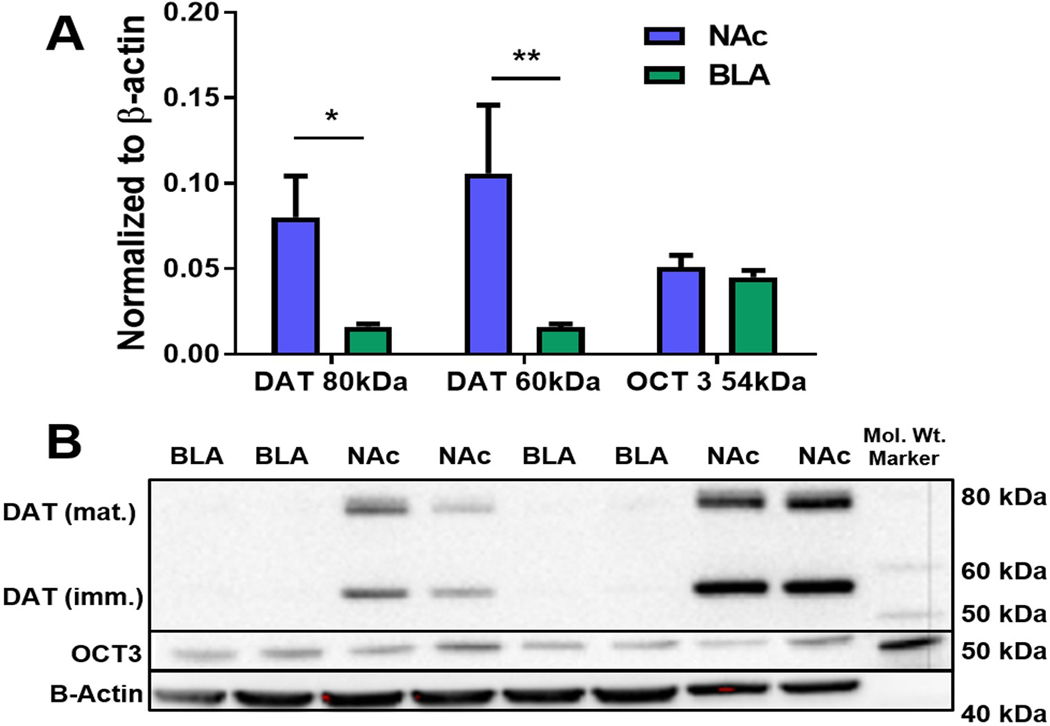
Figure 3: DAT protein levels are higher in the NAcc compared to the BLA, but OCT3 levels are similar between regions.
Western blot hybridization was used to detect and quantitate the observed variations in DAT and OCT3 densities in the NAcc and BLA. (A) DAT protein levels, normalized to β-actin, were significantly elevated in the NAcc compared to the BLA at both 78 kDa (p=0.0247) and 56 kDa (p=0.0011) molecular weights representing the mature and immature DAT isoforms, respectively. Conversely, the protein levels of OCT3 were similar in the NAcc and BLA (p>0.05). (B) Representative blot showing NAcc and BLA DAT and OCT3 protein levels quantified in the graph above. NAcc = nucleus accumbens core; BLA = basolateral amygdala; *p<0.05. (N=8 animals/group).

