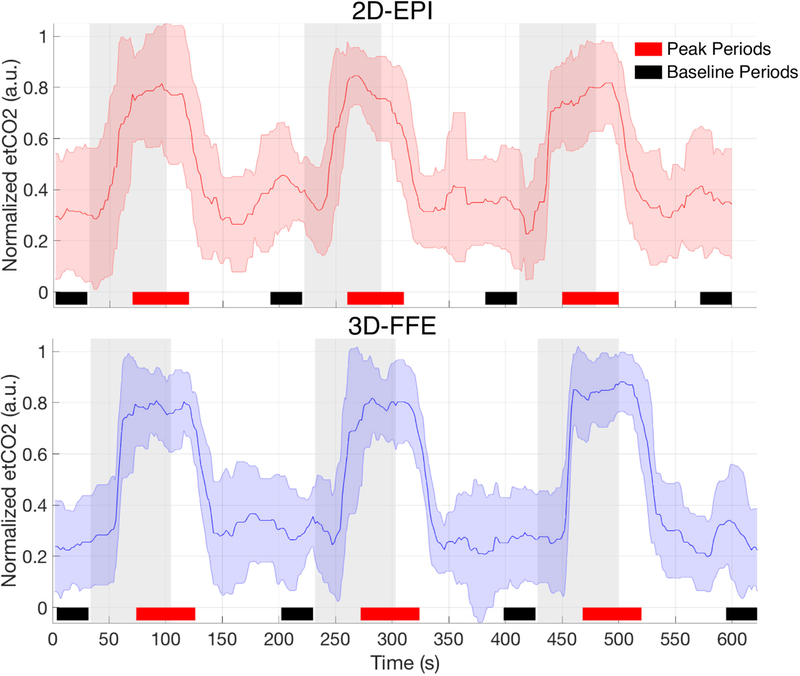
Figure 2:
Mean end-tidal CO2 timecourse over all subjects/runs. Raw end-tidal CO2 traces were median filtered and artifactual spikes were removed prior to group averaging. The gas presentation paradigm for the 2D-EPI acquisition was: 30s rest – 70s gas – 120s rest – 70s gas – 120s rest – 70s gas – 120s rest = 600s total. Due to a discrepancy in the true volume acquisition time reported by the scanner console, the paradigm for the 3D-FFE sequence was extended slightly: 31.8s rest – 72.9s gas – 125.3s rest – 72.9s gas – 123.4s rest – 72.9s gas – 123.5s rest = 622.7s total. Room air was delivered during rest periods, and gray bars represent delivery periods of a hypercapnic normoxia gas mixture (5% CO2, 21% O2, 74% N2). Mean signals across baseline periods (denoted by black bars) were used for percent signal change calculations, and peak periods (denoted by red bars) were used for mean peak signal change lines in Fig. 4.

