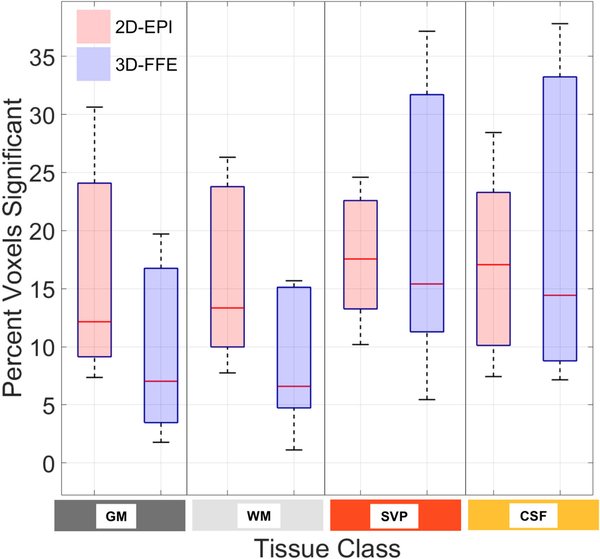
Figure 5:
Percentage of voxels, across subjects, exhibiting significant BOLD signal changes (p < 0.05, based upon a one-tailed test) in response to the hypercapnic gas challenge for each tissue class (defined in Fig. 1, bottom left) and acquisition scheme. For each subject, voxels with t > 1.65 (uncorrected) as determined from the GLM analysis are counted and expressed as a percent of the total number of voxels for each tissue class. There were no statistically significant differences between 2D-EPI and 3D-FFE across subjects (paired t-test, p > 0.05) despite different TEs for the two sequences.

