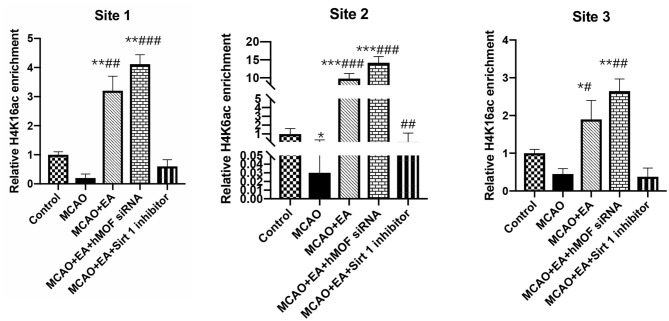
Figure 6.
ChIP analysis of the enrichment of acetylated H4K16 on the Beclin1 promoter. ChIP quantitative analysis of extracted chromatin from the brains of each group and precipitated with H4K16ac antibody. Quantitative PCR was used to amplify the Beclin1 promoter region. The following formula was used to normalize the input results and nonspecific IgG results: [2 – (ΔCt) specific antibody/2 – (ΔCt) nonspecific IgG], where ΔCp is the Cp (immunoprecipitated DNA) – Cp(input) and Cp is the cycle where the threshold is crossed. The position at the top of each figure shows three different transcription positions of the Beclin1 promoter region. Data were expressed as means ± SD; n = 6, *P < 0.01, **P < 0.001, ***P < 0.0001, vs. the control group; #P < 0.05, ##P < 0.01, and ###P < 0.001 vs. the MCAO group.

