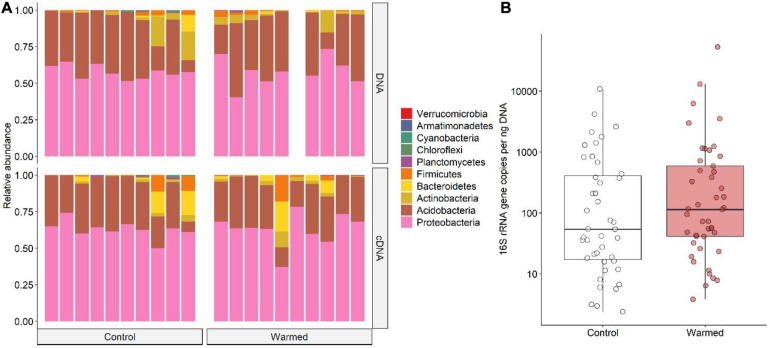
FIGURE 3.
(A) Barplots of the bacterial community composition associated with the lichen C. islandica in the control and warmed plots. Data are presented at the phylum level for DNA and cDNA. Bars represent pooled samples from each separate plot. (B) 16S rRNA gene abundance per ng extracted DNA in control (white) and warmed (red) samples. N = 88, nwarmed = 45, ncontrol = 43.

