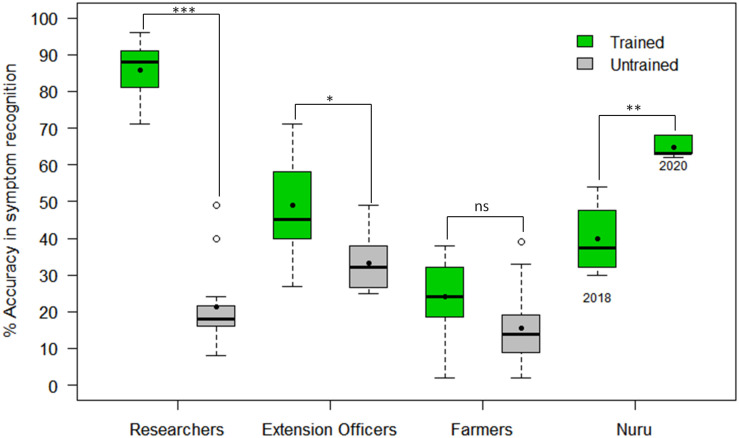
FIGURE 3.
Comparison of accuracy in recognizing symptoms of CMD, CBSD and CGM damage by PlantVillage Nuru, researchers, agricultural extension officers and farmers who have and those who have not previously received training on cassava diseases and pests (n = 22 for each paired comparison). The black line within the boxes represents the median, the top and bottom of the box represent the 75th and the 25th percentiles, the whiskers represent the maximum and minimum values while the symbols (●) and (○) represent the mean and the outlier.

