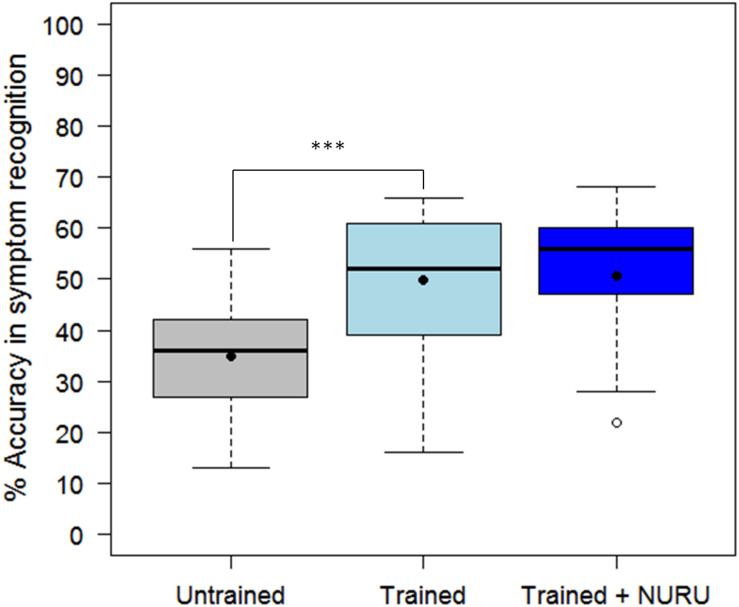
FIGURE 4.
Comparison of the ability of 30 agricultural extension officers and 50 farmers to accurately recognize symptoms of CMD, CBSD, and CGM-damage before and after receiving training on cassava pests and diseases. The black line within the boxes represents the median, the top and bottom of the box represent the 75th and the 25th percentiles, the whiskers represent the maximum and minimum values while the symbols (●) and (○) represent the mean and the outlier.

