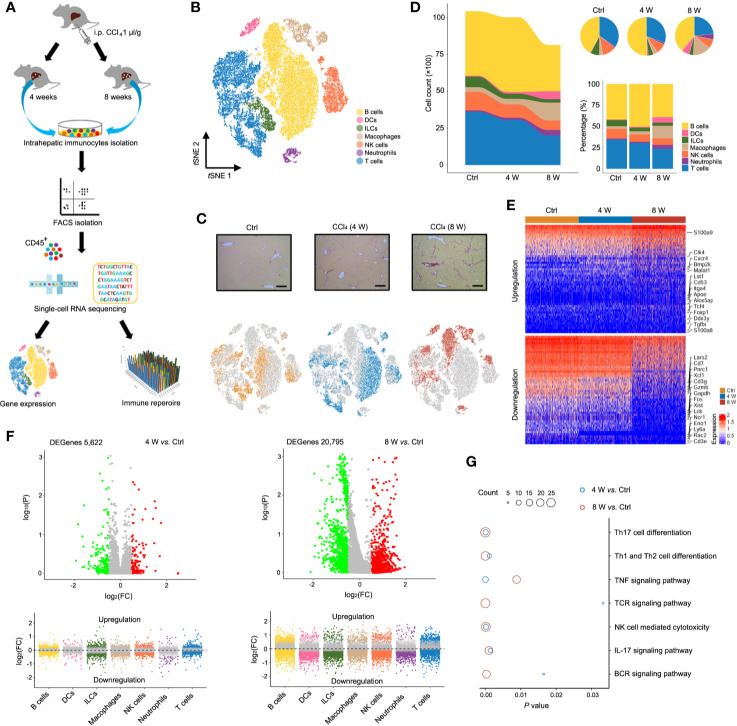
Figure 1.
Single-cell atlas of intrahepatic immune cells. (A) Flow chart of scRNA-seq and IR-seq. (B) scRNA-seq of intrahepatic immune cells from untreated and 4- and 8-week CCl4-treated livers. tSNE clustering of 28,608 single-cell transcriptomes (Ctrl: 10,436 cells, 4-week: 10,028 cells and 8-week: 8,144 cells, n = 4) colored according to cell-type clusters. (C) Representative Sirius red staining of untreated, 4- and 8-weeks CCl4-treated livers (up). tSNE clustering as in b, but colored according to groups (down). (D) The number and percentage of each cell type. (E) Heatmap showing Z-scored mean expression of differentially expressed genes (DEGenes top 50). (F) A volcano plot showing DEGenes among the groups (up). Liver fibrosis-dependent gene expression in each cell type (down). Green dots indicate significantly decreased DEGenes, while red dots indicate significantly increased DEGenes. (G) Pathway enrichment for the DEGenes among the groups. Circle size indicates enrichment gene number (complete pathway enrichment available in Table S3).

