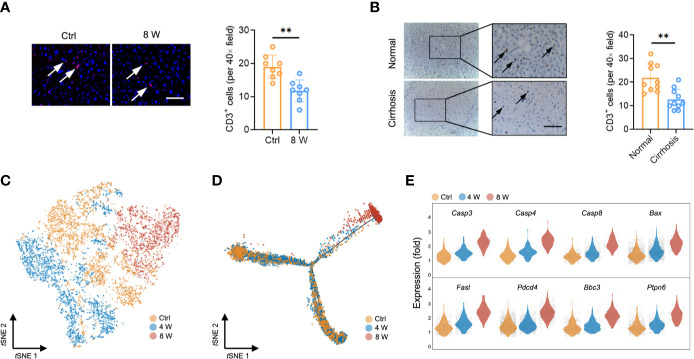
Figure 2.
T cell reduction during liver fibrosis. (A) Representative images of immunofluorescence results of CD3 in untreated and 8-week CCl4-treated livers (n = 8, **P < 0.01). Scale bar, 100 μm. (B) Representative images of immunohistochemistry results of CD3 in human normal and cirrhotic livers (n = 10, **P < 0.01). Scale bar, 100 μm. (C) tSNE clustering of 8,573 single-cell transcriptomes (T cells) colored by groups. (D) Trajectory analysis for T cell scRNA-Seq data in a two-dimensional state-space inferred by Monocle 2. (E) Normalized expression values of 8 apoptotic genes (Casp3, Casp4, Casp8, Bax, Fasl, Pdcd4, Ptpn6, and Bbc3) in T cells.

