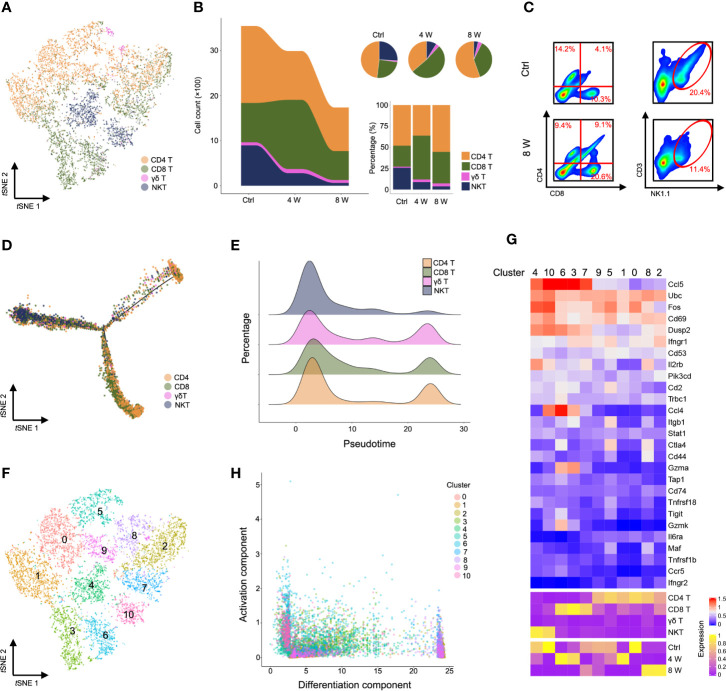
Figure 3.
Characterization of T cells during liver fibrosis. (A) tSNE clustering as in c, but colored by T cell type (CD4 T, CD8 T, γδ T, and NKT). (B) The number and percentage of T cell types. (C) Flow cytometry for CD4 T cells (CD4+), CD8 T cells (CD8+) and NKT cells (NK1.1+, CD3e+) in untreated, 8-week CCl4-treated livers. (D) Trajectory analysis of CD4 T, CD8 T, γδ T and NKT cells. (E) Percentage of four T cell clusters inferred by Monocle’s pseudotime ordering as in d. (F) T cells identified using unsupervised clustering based on tSNE. (G) Heatmap showing the expression of immune-activated genes with Z scores standardized across each cluster, cell type and group (complete data available in Table S7). (H) Visualization of all T cell clusters using the activation component and differentiation component. Each dot represents a cell colored by cluster.

