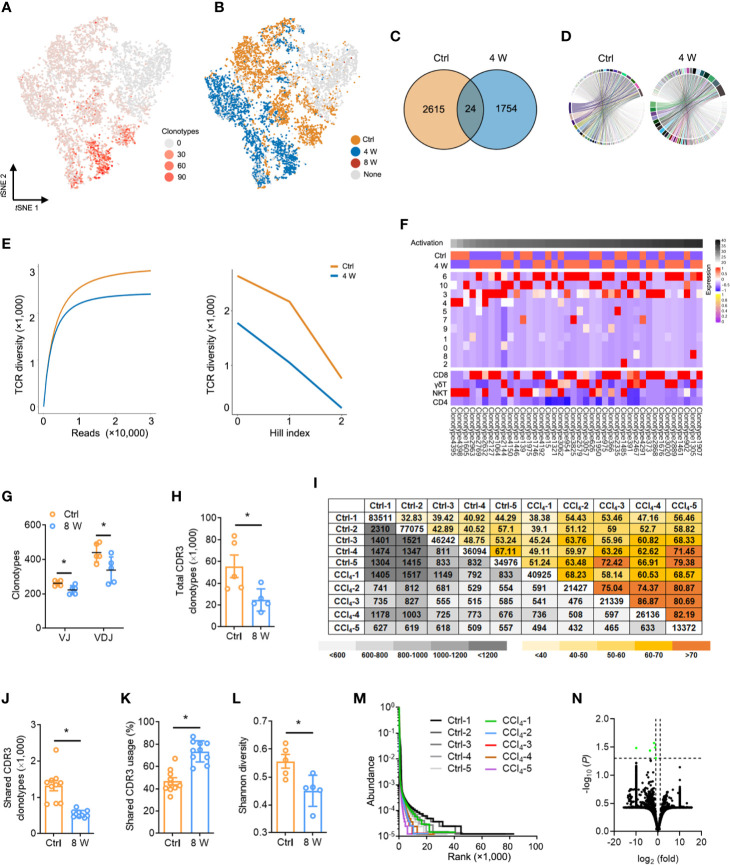
Figure 4.
Fibrogenesis shapes shrunk TCR repertoires. (A) tSNE plot colored with single-cells with a high frequency of TCR clonotypes shown in red, and those with a low frequency are shown in grey (complete data available in Table S8). (B) tSNE plot of TCR clonotypes colored by groups. (C) Venn diagrams showing the number of TCR clonotypes in scRNA-seq data from untreated and 4-week CCl4-treated livers. (D) The composition of the VJ combination. The color indicates distinct V and J segments. (E) Dilution curve (left) and Hill index (right) showing TCR diversity. (F) A heatmap showing the expression pattern of the top 40 TCR clonotypes with Z scores standardized across each cluster, cell type, and group (complete data available in Table S8). (G) TCRβ IR-seq of intrahepatic immune cells from untreated and 8-week CCl4-treated livers. Clonotypes of TCRβ VJ and VDJ combination. (H) A total of TCRβ CDR3 AA clonotypes in each group (complete data in Table S11). (I) Quantification (grey plots) and frequency (colored plots) of intrahepatic TCRβ CDR3 AA clonotypes. Uncolored plots indicate the total clonotypes per sample. (J) The shared TCRβ CDR3 AA clonotypes in each group. (K) The percentage of shared TCRβ CDR3 AA clonotypes in each group. (L) Shannon diversity showing TCRβ CDR3 AA diversity. (M) Rank-abundance curve showing TCRβ CDR3 AA richness and evenness. (N) A volcano plot showing TCRβ CDR3 AA clonotypes. Green dots indicate significantly downregulated TCRβ CDR3 AA clonotypes. In each experimental group, five to 10 mice were used. *P < 0.05.

