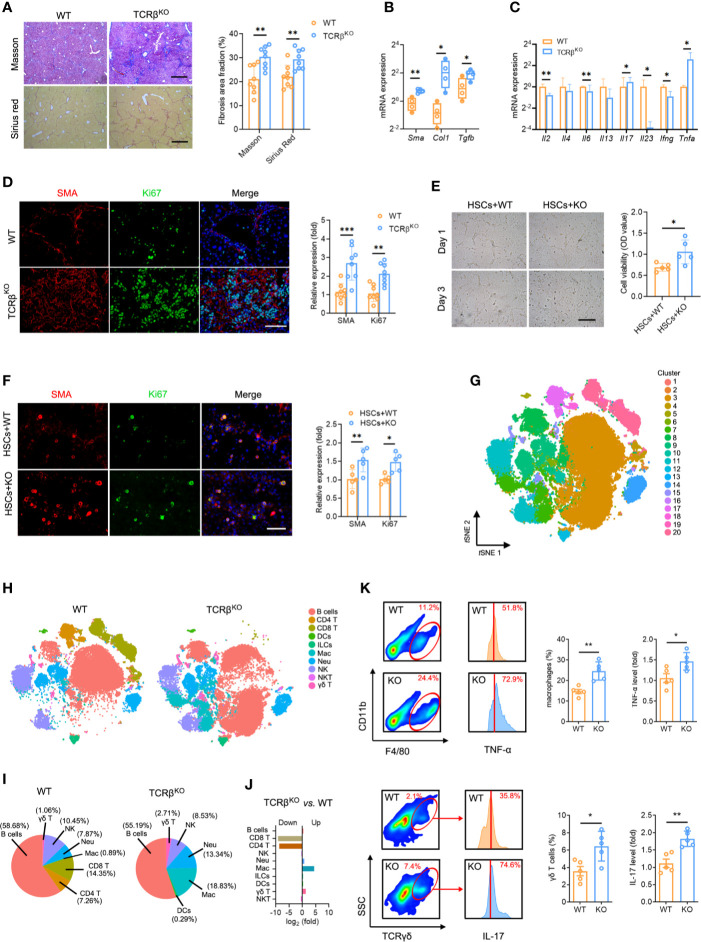
Figure 5.
TCRβ deficiency aggravated CCl4-induced liver fibrosis. (A) WT and TcrbKO mice were treated 3 times weekly with CCl4 for 4 weeks. Representative Masson trichrome staining and Sirius red staining of liver tissues are shown. Scale bar, 200 μm. Quantification of the fibrosis area fraction in 10 cross-sections. (B) qPCR analysis of fibrosis-related mRNA levels of Sma, Col1, and Tgfb in the liver after CCl4 treatment. (C) qPCR analysis of inflammation-related mRNA levels of Il2, Il4, Il6, Il13, Il7, Il23, Ifng, and Tnfa. (D) Liver sections were stained for SMA (red) and Ki67 (green) to identify proliferating HSCs. Representative images are shown. Scale bar, 100 μm. Quantification of SMA and Ki67 expression in 10 cross-sections. (E) Representative images showing day 1 and day 3 cocultures of primary HSCs (isolated from WT mouse livers) with intrahepatic immune cell (isolated from WT or TcrbKO mouse livers after CCl4 treatment for 8 weeks). Scale bar, 50 μm. Cell viability was estimated using the CCK-8 assay after coculture for 3 days. (F) Immunofluorescence staining for SMA (red) and Ki67 (green) was performed to identify proliferating HSCs. Representative images are shown (left). Scale bar, 50 μm. Quantification of SMA and Ki67 expression. (G) Mass cytometry of intrahepatic immune cells from WT and TcrbKO mice (n = 4) after 4 weeks of CCl4 treatment (50,000 cells for each sample). tSNE plot showing all cells identified using unsupervised clustering. (H) tSNE clustering as in e, but colored by immune cell type. (I) The percentage of each immune cell in WT and TcrbKO after 4-week CCl4 treatment. (J) The ratio [log2(fold)] of distribution of each immune cell type. (K) Intrahepatic macrophages (F4/80+ and CD11b+, up) and γδ T cells (TCRγδ+, down) in the fibrotic liver detected by FACS (10,000 cells for each sample). Representative FACS plots are shown. Intrahepatic macrophages and γδ T cells harvested from fibrotic livers were gated and used to test for the expression of TNF-α (up) and IL-17 (down). Approximately four to eight mice were used in each experimental group. *P < 0.05; **P < 0.01; ***P < 0.001.

