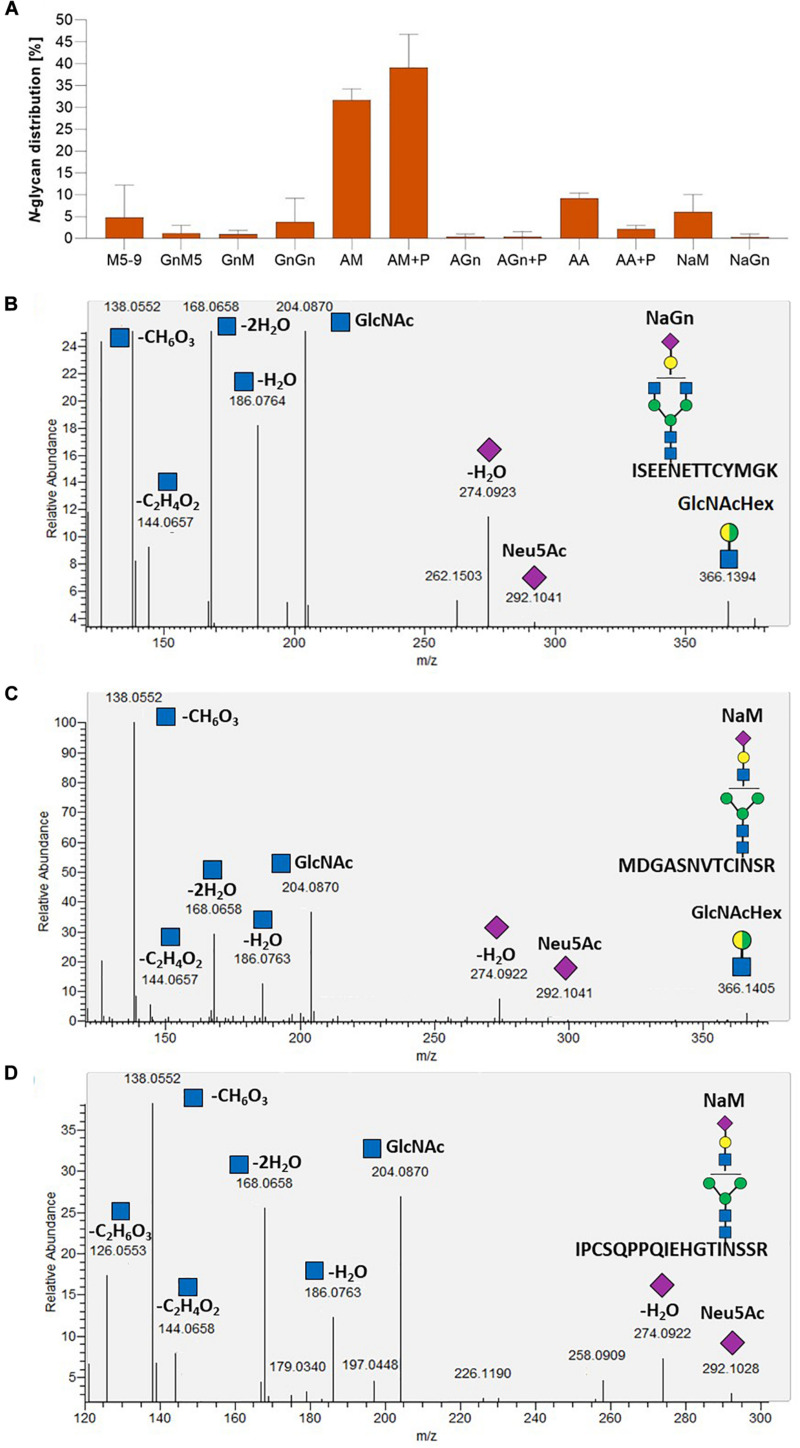
FIGURE 11.
Mass spectrometric analysis of the glycosylation pattern in GMC_GT_FTST78 and MS2-based verification of sialylated glycopeptides. (A) MS-based relative quantification of glycopeptides identified on the tryptic digested reporter glycoprotein of the complete sialylation line GMC_GT_FTST78 with a chimeric sialytransferase. Relative quantification was based on peak area integration of extracted ion chromatograms (EICs) on MS1 level, for which glycopeptide identities were confirmed on MS2 level. For quantification, areas of all confirmed peaks per measurement were summed up and the relative percentages are given for each identified glycan structure. The error bars indicate the standard deviation between the three analyzed glycopeptides. (B–D) MS2-based verification of N-glycan sialylation on all three analyzed tryptic glycopeptides by the identification of N-acetylglucosamine (GlcNAc) and sialic acid (Neu5Ac) reporter ions with the following m/z-values: [GlcNAc]+ = 204.087, [GlcNAc - H2O]+ = 186.076, [GlcNAc - 2H2O]+ = 168.066, [GlcNAc - C2H4O2]+ = 144.065, [GlcNAc - CH6O3]+ = 138.055, [GlcNAc - C2H6O3]+ = 126.055), [Neu5Ac]+ = 292.103, [Neu5Ac - H2O]+ = 274.092 and the detection of the glycan fragment ion [GlcNAcHex]+ = 366.139. M, mannose (green circle); Gn, N-acetylglucosamine (blue square); A, galactose (yellow circle); Na, sialic acid (purple rhombos); Hex, hexose (yellow and green circle: stands for the presence of either mannose or galactose).

