FIGURE 3.
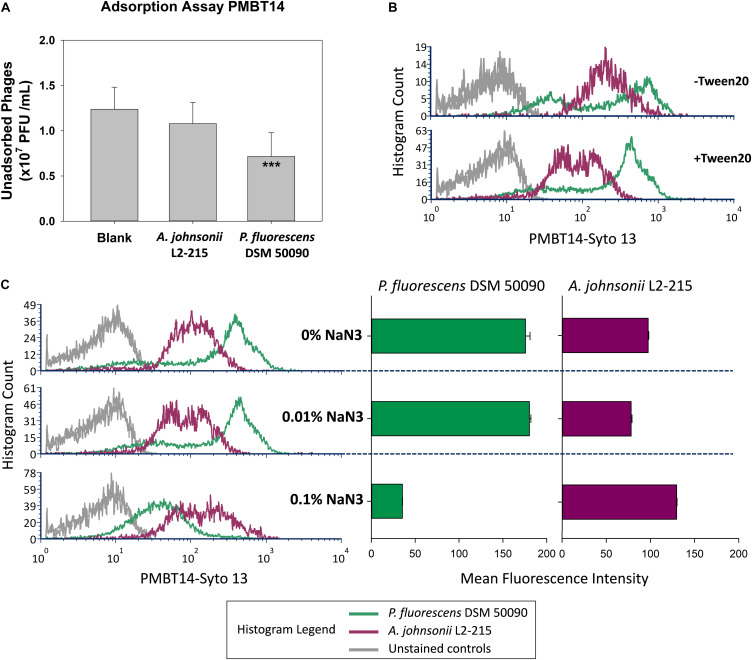
Characterization of unspecific staining in A. johnsonii. (A) Standard adsorption assay of PMBT14 using A. johnsonii L2-215 and host P. fluorescens DSM 50090. Bar graphs depict the amount of unadsorbed bacteriophage (n = 12 from four experiments). One-way ANOVA was used to compare the means between the groups (2 degrees of freedom; F-value 13.968; *p < 0.05; **p < 0.01; ***p < 0.001). (B) Staining intensity of Tween 20 treated (+Tween 20) PMBT14-Syto 13 versus original untreated PMBT14-Syto 13 (–Tween 20). (C) Histograms (left) depicting the effect of increasing concentrations of sodium azide on the fluorescence of P. fluorescens DSM 50090 and A. johnsonii L2-215 after incubation with PMBT14-Syto 13. Bar graphs (right) depict the corresponding mean fluorescence intensity with SEM (n = 3).

