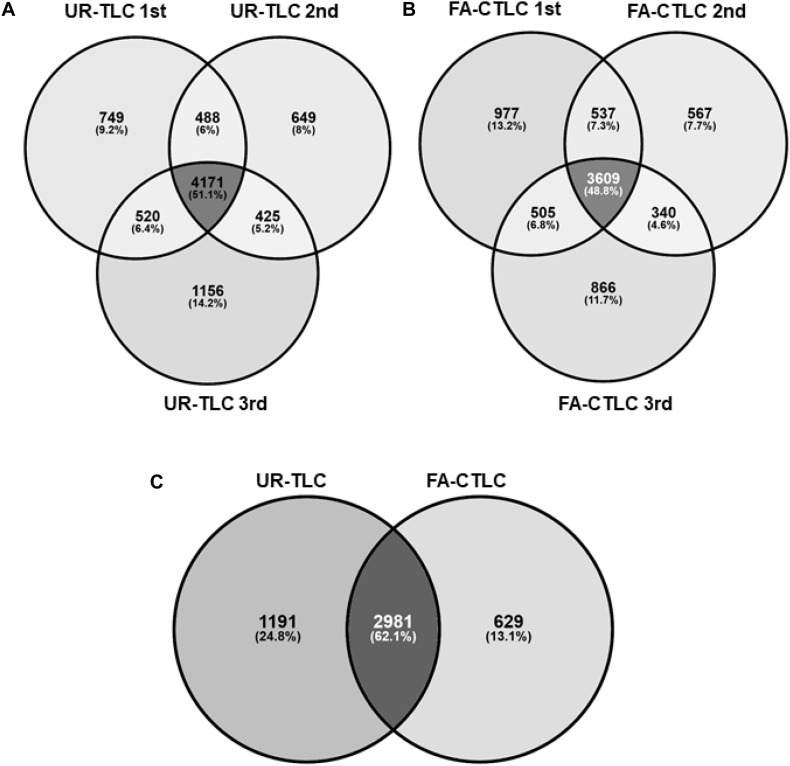
FIGURE 2.
Analysis of the proteins identified by MS-MS after UR-TLC or FA-CTLC. (A) The reproducibility of protein identifications between the three biological repeats following UR-TLC treatment. (B) Reproducibility of protein identifications between the three biological repeats following FA-CTLC treatment. (C) A comparison of proteins identified by each treatment. The schematic diagrams were made by the Venny online tool (http://bioinfogp.cnb.csic.es/tools/venny/).

