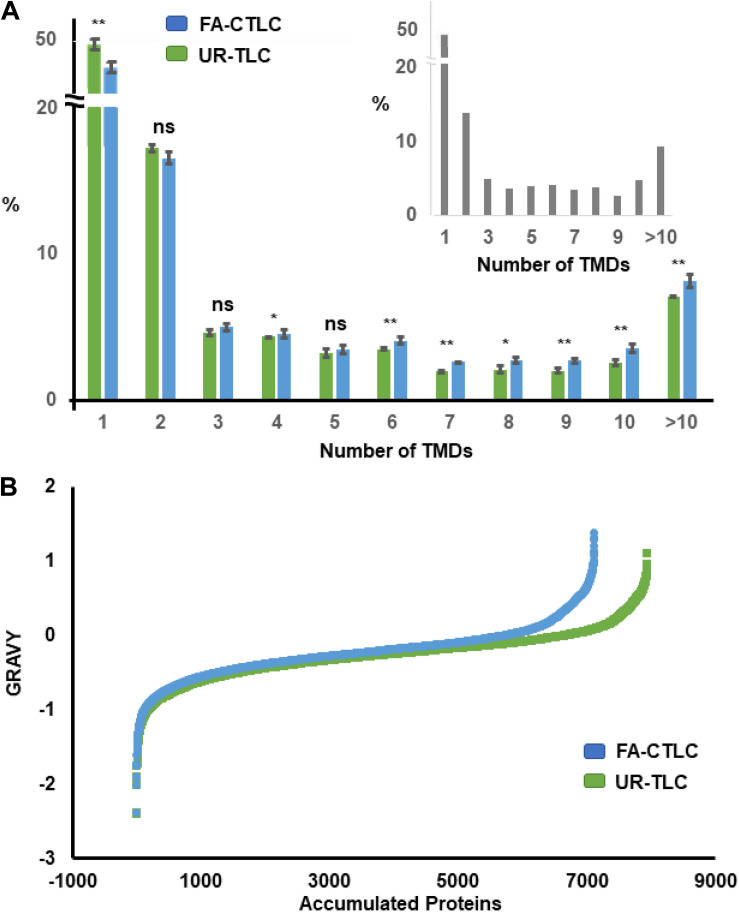
FIGURE 3.
Distribution of proteins identified after applying the FA-CTLC or UR-TLC methods to Medicago microsomal membrane (MM) preparations from three biological repeats based on transmembrane domain (TMD) number and grand average of hydropathy (GRAVY) score. (A) The proteins identified after analyzing the UR-TLC- or FA-CTLC-treated samples from three biological repeats were submitted to the TMHMM server. The total predicted number of transmembrane protein (TMP) groups in the UR-TLC and FA-CTLC samples was 2,817 (35.45%) and 2,784 (39.11%), respectively. The predicted TMD distribution of the Medicago proteins in the UniProt database is shown in the inset panel as a comparison. There were 23.26% proteins predicted to be TMPs. *p ≤ 0.05, **p ≤ 0.01 (two-tail Student’s t–test). Error bars = standard error, n = 3. (B) The GRAVY scores were calculated (Kyte and Doolittle, 1982) from the proteins identified after analyzing the UR-TLC or FA-CTLC base on the previous published literature. Approximately 20% of proteins identified by FA-CTLC displayed a GRAVY score greater than zero and 17% of proteins identified by UR-TLC. Proteins with a hydrophobicity scores above 0 are more likely to be TMPs.

