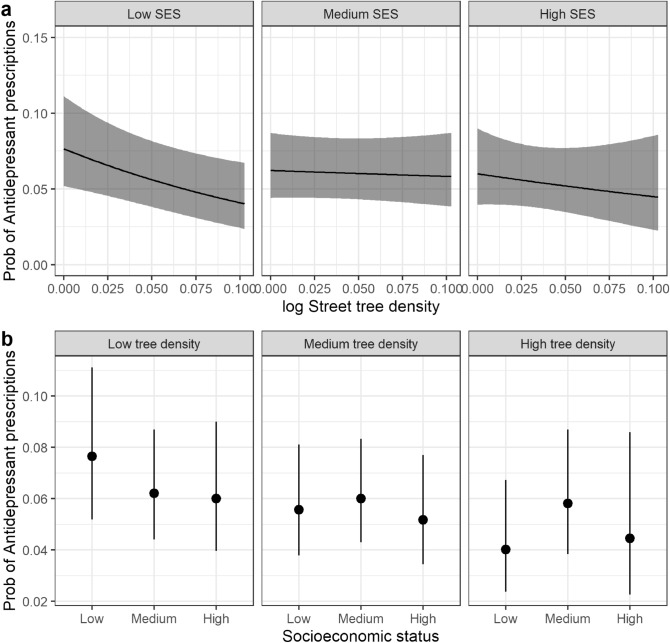
Figure 4.
(a) Probability of antidepressant prescriptions as a function of street tree density 100 m around the home and individual socio-economic status (SES). The black line is the mean and the shaded area are the 95% confidence intervals. The regression is statistically significant ( p< 0.01) for low SES but not for medium or high SES. (b) Probability of antidepressant prescriptions as a function of low (0), medium (average) and high (max) street tree density 100 m around the home stratified by SES. The black dot is the mean and the black line is the 95% confidence interval.

