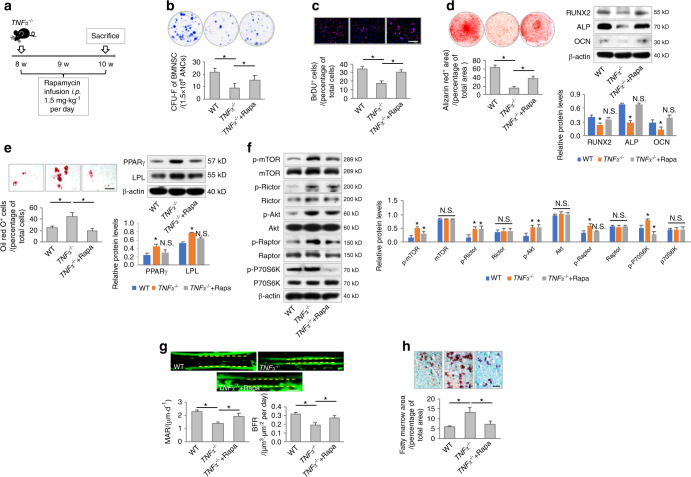
Fig. 4.
Rapamycin infusion improves MSC function in TNFα−/− mice in vivo. a Schematic diagram showing the experimental design to investigate the effect of rapamycin treatment on TNFα−/− mice in vivo. b–e Functional analyses of MSCs according to CFU, BrdU labeling, and osteogenic and adipogenic differentiation (N = 5). Scale bars = 100 μm. f Western blot analyses of mTOR signaling (N = 3). g Calcein labeling for bone formation analysis. N = 5. Scale bar = 50 μm. h Oli red O staining for bone marrow adiposity. N = 5. Scale bar = 150 μm. For quantification of Western blotting, a two-tailed Student’s t test was used for the comparison between the treatment and WT groups. *P < 0.05. Data represent the mean ± SD

