Fig. 5.
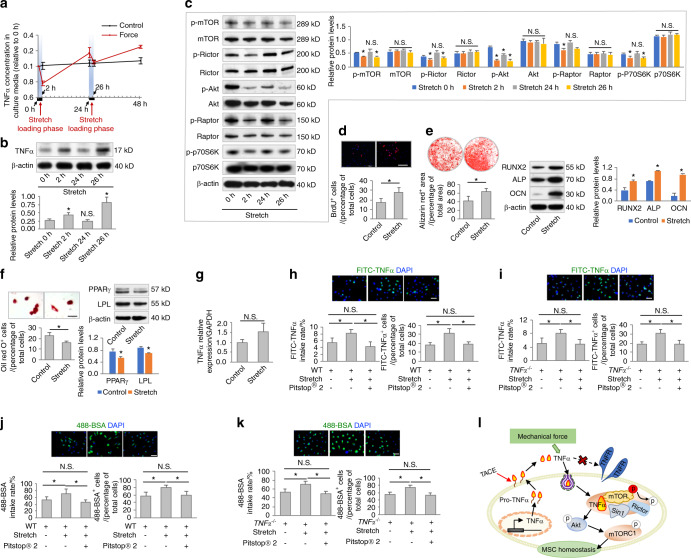
Mechanical force drives TNFα endocytosis and promotes MSC function. a, b Examination of secreted concentrations and protein expression levels of TNFα. MSCs underwent cyclic loading of stretch force at 15% elongation, 0.5 Hz. N = 3. c Western blot analyses of mTOR signaling (N = 3). d–f Functional analyses of MSCs according to BrdU labeling and osteogenic and adipogenic differentiation. N = 3. Scale bars = 100 μm. Stretch force was applied twice per week for 2 h per session. g qRT-PCR analysis of the mRNA expression levels of TNFα (N = 3). h, i Endocytosis analysis of FITC-labeled TNFα uptake by MSCs for 2 h in vitro. Pitstop® 2 was used to inhibit clathrin-mediated endocytosis at 12 μmol·L−1. Stretch force was applied for a 2 h period. N = 3. Scale bars = 20 μm. j, k Endocytosis analysis of Alexa FluorTM 488-conjugated bovine serum albumin (488-BSA) taken up by MSCs for 2 h in vitro. Pitstop® 2 was used to inhibit clathrin-mediated endocytosis at 12 μmol·L−1. Stretch force was applied for a 2 h period. N = 3. Scale bars = 20 μm. l Diagram showing mechanical force-driven TNFα endocytosis. For quantification of Western blotting, a two-tailed Student’s t test was used for the comparison between the treatment and stretch 0 h/control groups. *P < 0.05. N.S. not significant. Data represent the mean ± SD

