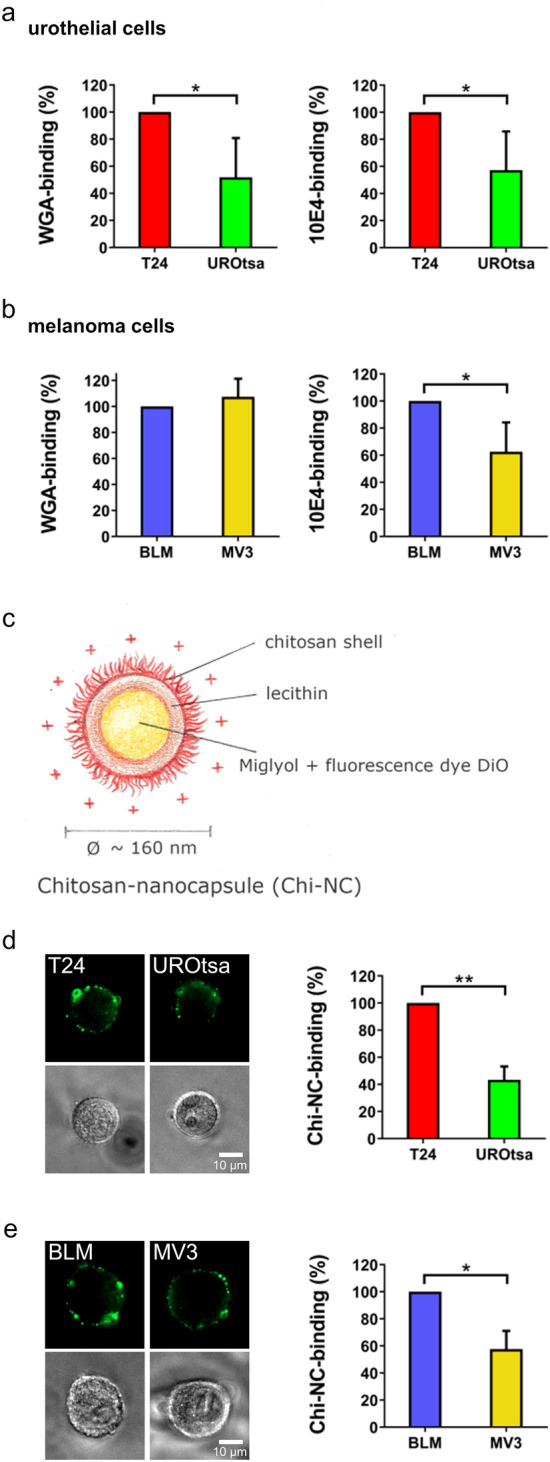
Figure 3.

Expression of glycans and Chi-NC binding capacity of urothelial and melanoma cells. (a,b) Comparison of the WGA-binding ability and heparan sulphate expression (10E4-binding) of urothelial cells (a) and melanoma cells (b). (c) Schematic illustration of Chi-NCs. (d,e) Urothelial cells (d) and melanoma cells (e) were treated with Chi-NCs (1.78 × 10¹² particles mL−1). Prior to flow cytometry, binding of Chi-NCs (green) to the cellular surface was verified by fluorescence microscopy (upper panels). Presence of cells was proven by phase-contrast microscopy (lower panel). Scale bars = 10 µm. The bar diagram shows the quantitative evaluation of flow cytometric results. Data were normalised to the corresponding mean fluorescence of T24 or BLM cells. Data are presented as mean ± SD (n = 3–4, *p < 0.05, **p < 0.01).
